Prisma Browser
Table of Contents

Prisma Browser
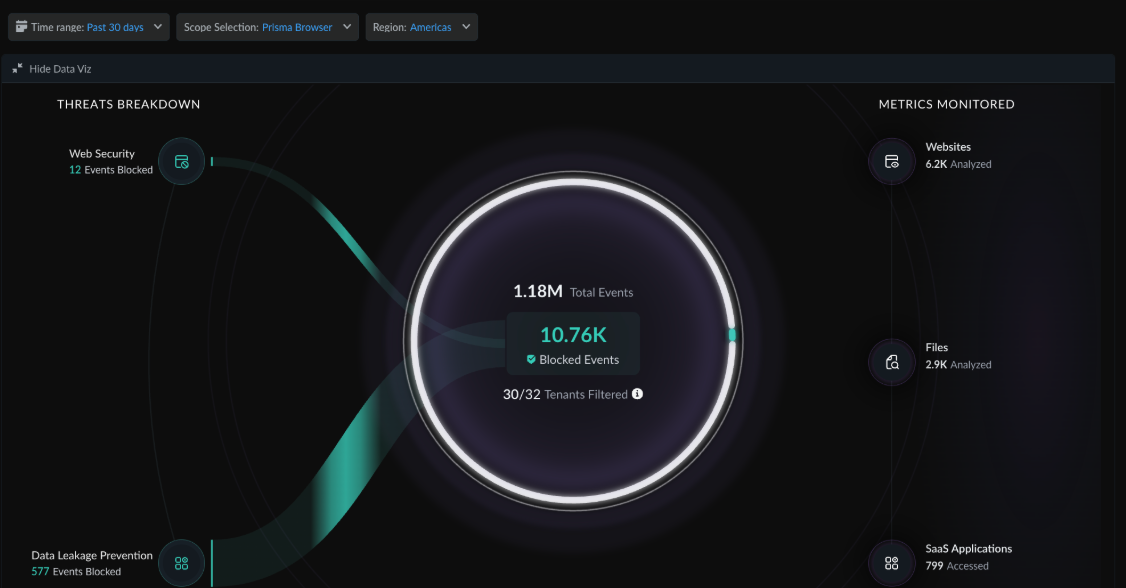
When you select Prisma Browser as the scope, the Security view displays event-based security metrics.
When you select Prisma Browser as the scope, the Security view displays event-based security metrics. In Prisma Browser, all security activity is categorized as events.
Security Events
| Widget | Description |
|---|---|
| Web Security | Total web security events blocked across filtered tenants. |
| DLP (Data Loss Prevention) | Total DLP events blocked. |
Drill-Down Metrics
Below the primary event counts, the view provides deeper context under Metrics Monitored:
| Metric | Description |
|---|---|
| Websites Analyzed | Total number of websites processed by Prisma Browser across filtered tenants. |
| Files Analyzed | Total number of files inspected for threats or policy violations. |
| SaaS Applications Accessed | Total number of SaaS applications accessed through Prisma Browser. |
| Events — Total vs. Blocked | Comparison of total events generated versus events that were successfully blocked. |
These metrics help you understand the volume of activity that contributed to the blocked event counts and identify areas where events were not blocked.
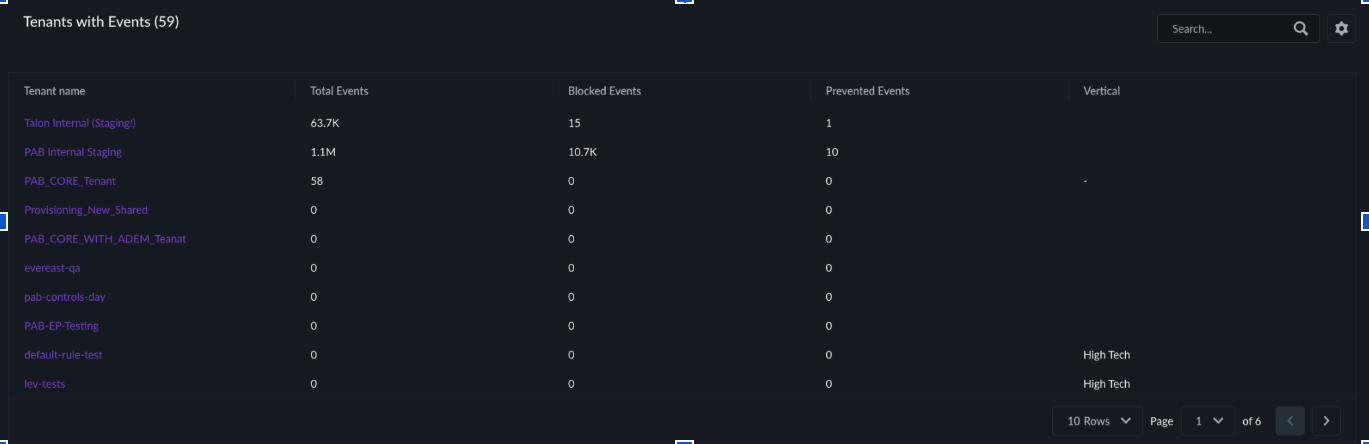
Tenant Table
The tenant table shows per-tenant event counts so you can identify which tenants generate the most security events and where blocking actions occurred.