Prisma Access
Table of Contents

Prisma Access
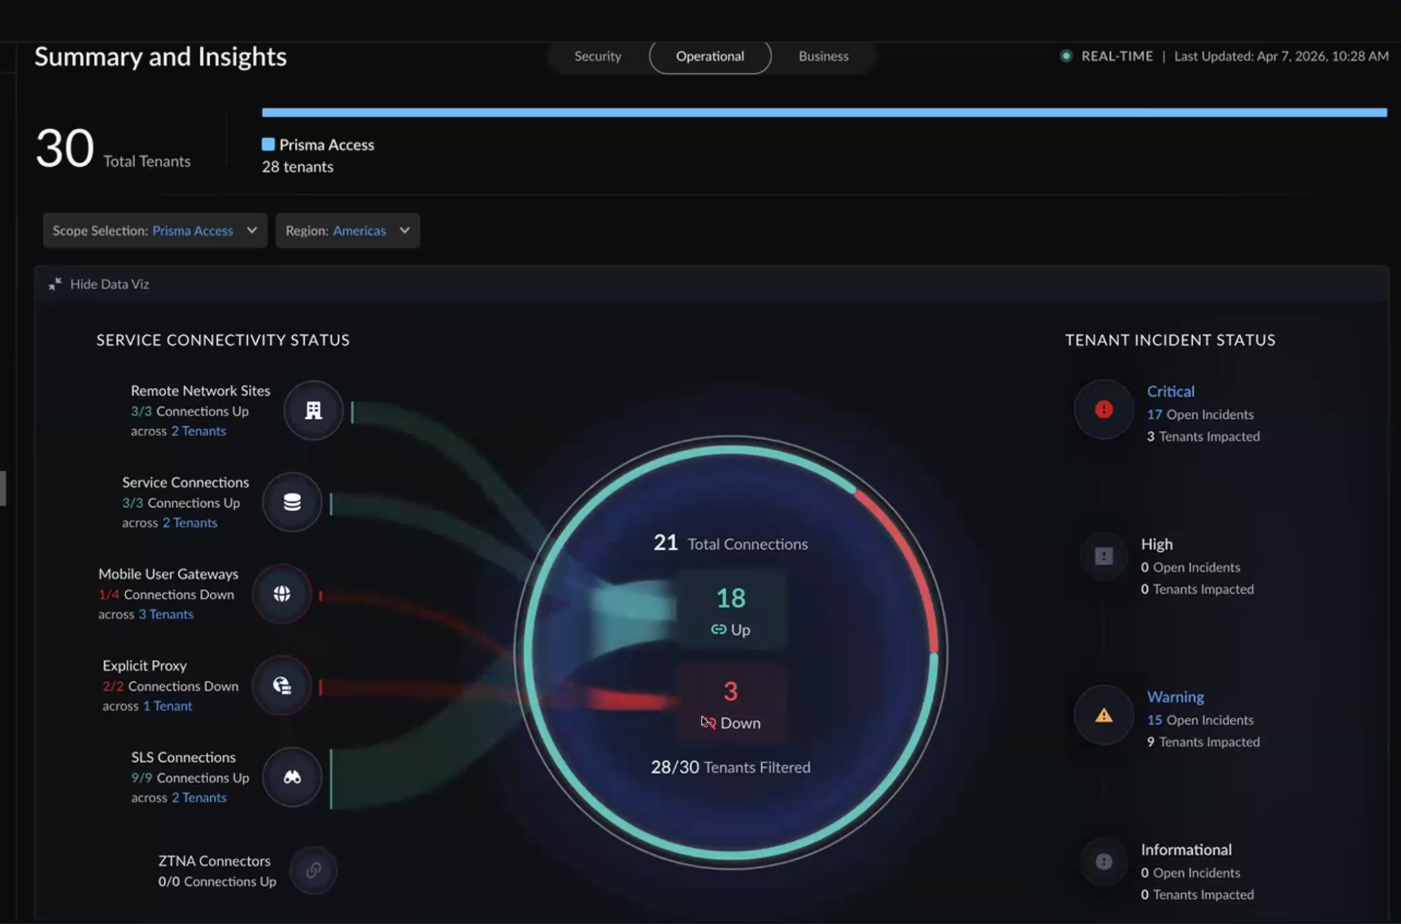
The Prisma Access operational view is split into two sections: Service connectivity on the left and incident status on the right.
The Prisma Access operational view is split into two sections: Service connectivity on the left and incident status on the right.
Service Connectivity Status
The view displays the status (up or down) of connections aggregated across all filtered Prisma Access tenants, organized by connectivity channel:
| Channel | Description |
|---|---|
| Remote Network Sites | IPSec tunnels connecting remote branch offices to Prisma Access. The count reflects the number of remote network sites that are up or down, not individual tunnels. If all tunnels are down causing a remote network to be down on a specific tenant, the count for connections under Remote Network Sites increases. |
| Service Connections | Site-to-site connections between Prisma Access and your corporate network. |
| Mobile User Gateways | MU gateway connectivity. |
| Explicit Proxy | Connections through the explicit proxy service. |
| SLS Connections | Strata Logging Service connections. |
| ZTNA Connectors | Zero Trust Network Access connectors. |
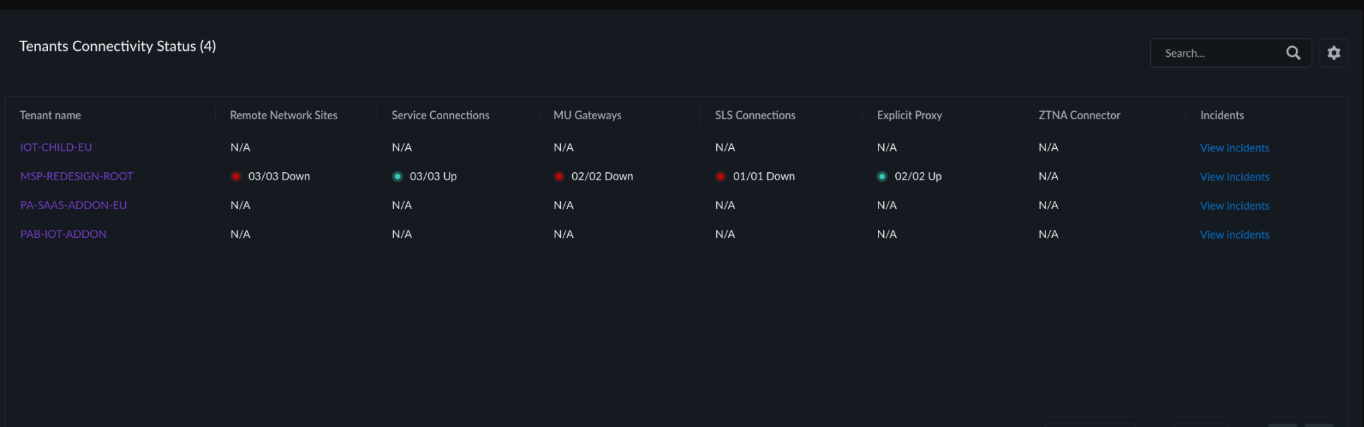
For each channel, the view shows the total number of RNs (Remote Network Sites), SCs (Service Connections), and other service endpoints that are up and the number that are down. The counts reflect service-level status, not individual tunnel status. Endpoints in the "down" state require your attention. Click the "down" count to filter the tenant table to only those tenants where the issue exists, so you can identify and resolve the problem.
Incidents
The incidents section displays the count of active incidents across filtered tenants, categorized by severity:
| Severity | Description |
|---|---|
| Critical | Requires immediate attention; significant impact on service. |
| High | Important issue that should be addressed soon. |
| Warning | Potential issue that should be monitored. |
| Informational | Low-priority notification for awareness. |
Clicking an incident count redirects you to the dedicated Incidents page (available in the left navigation) where you can view detailed incident information and take action.
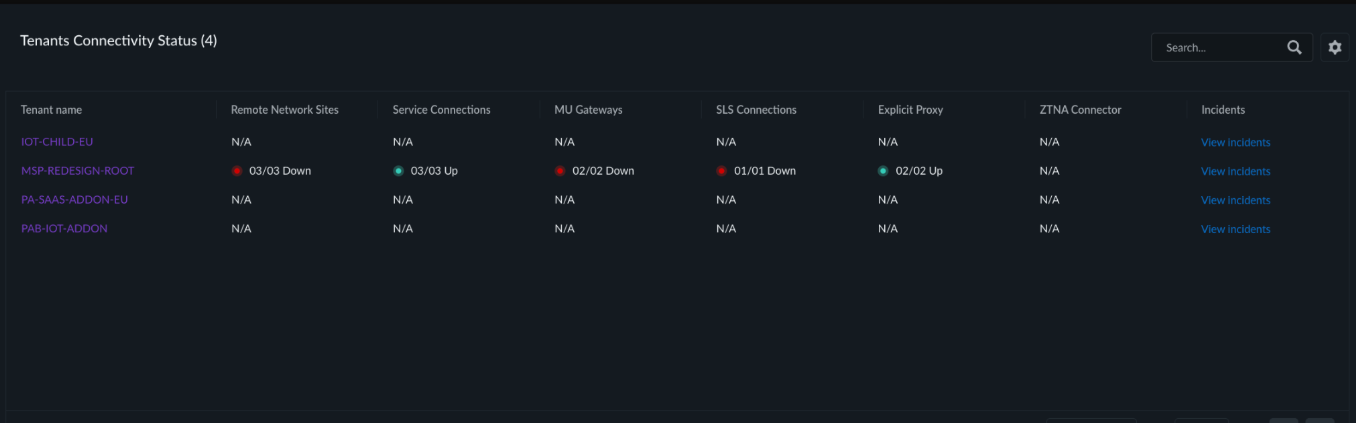
Tenant Table
The tenant table shows per-tenant connectivity status across all channels, allowing you to identify exactly which tenants have infrastructure issues.