Security
Table of Contents

Security
The Security view helps you assess how effectively your security services detect and block threats across your tenants by displaying threat data categorized by product and service type.
| Where Can I Use This? | What Do I Need? |
|---|---|
|
|
The Security view helps you assess how effectively your security services detect and block threats across your tenants. Select the product using the scope selection to view security data for Prisma Access, Prisma SD-WAN, or Prisma Browser.
Security Views
Select a product to view the tracked security data and metrics.
Prisma Access
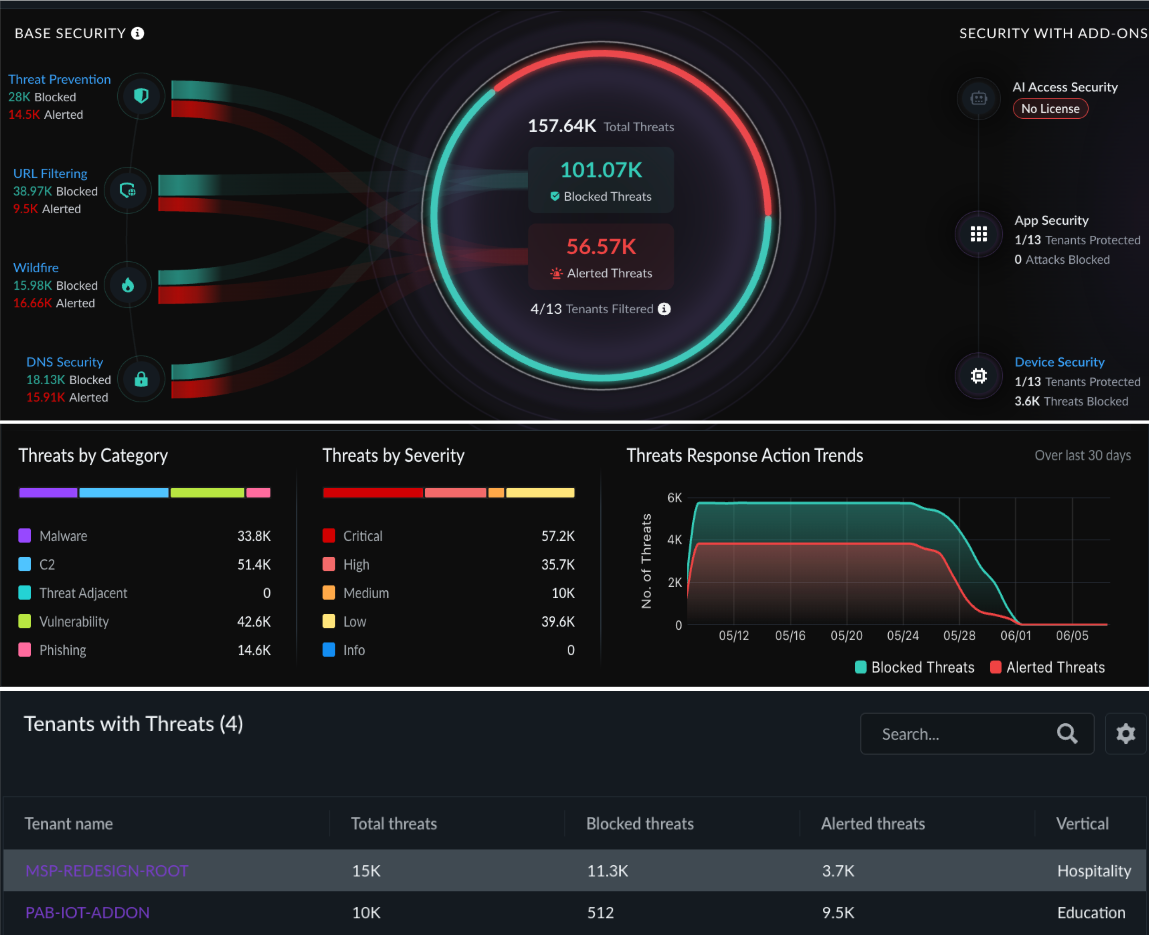
When you select Prisma Access as the scope, the Security view displays threat data categorized into base security services and add-on services.
When you select Prisma Access as the scope, the Security view displays threat data categorized into base security services and add-on services.
All metrics reflect threats and malicious activities detected and blocked across tenants within the selected time range.
Base Security
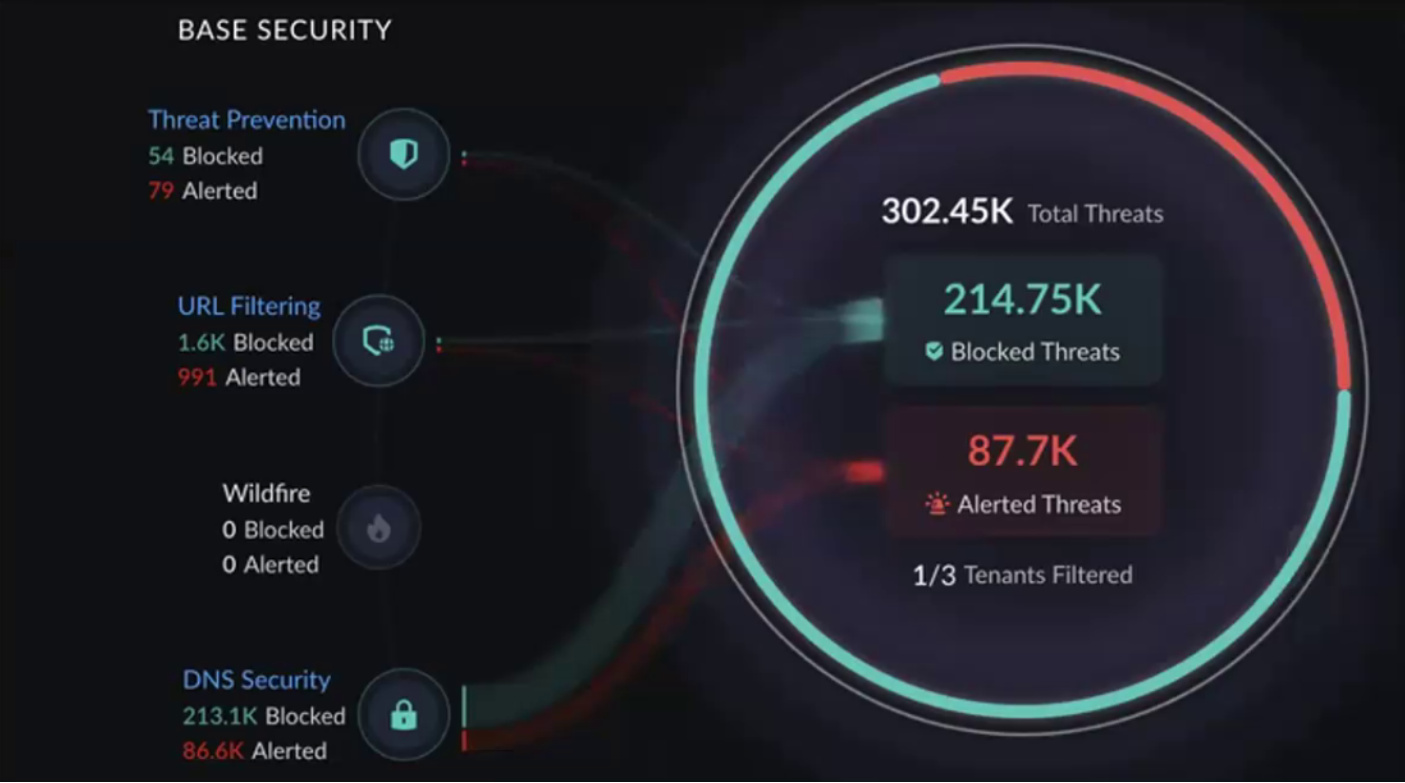
These services are included with your Prisma Access license and display data for
all filtered tenants:
| Widget | Description |
|---|---|
| Threat Prevention | Total threats detected and blocked across all filtered tenants. |
| URL Filtering | Total malicious URLs identified and blocked. |
| WildFire | Total malware samples detected and blocked through WildFire analysis. |
| DNS Security | Total DNS-based threats blocked. Hover over the widget to view the breakdown between Advanced DNS Security and Base DNS Security. Both are included by default with Prisma Access. |
The view aggregates these metrics across all Prisma Access tenants that fall
within the selected region. For example, if you select the Americas region and
three tenants have Prisma Access enabled in that region, the widgets display the
combined totals for those three tenants.
Add-on Security
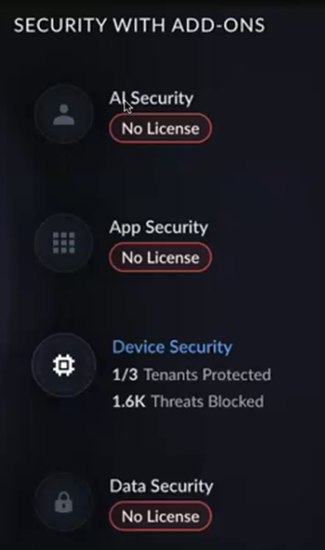
These services require additional licenses beyond the base Prisma Access subscription. The view displays the following add-on widgets:
| Widget | Description |
|---|---|
| AI Access Security | Threats related to AI-driven traffic that were detected and blocked. |
| App Security | Application-level threats identified and blocked. |
| Device Security | IoT device threats detected and blocked across filtered tenants. |
For each add-on widget, the view indicates how many of the filtered tenants have the add-on license activated. If none of the filtered tenants have a particular add-on license, the widget displays No License. This helps you identify tenants where you might want to activate additional security services.
The view distinguishes between "No License" (the add-on is not activated on any filtered tenant) and "No Data" (the license is active but no relevant security events were recorded during the selected time range).
Additional Security Metrics
Below the main widgets, the Security view displays three additional panels:
| Panel | Description |
|---|---|
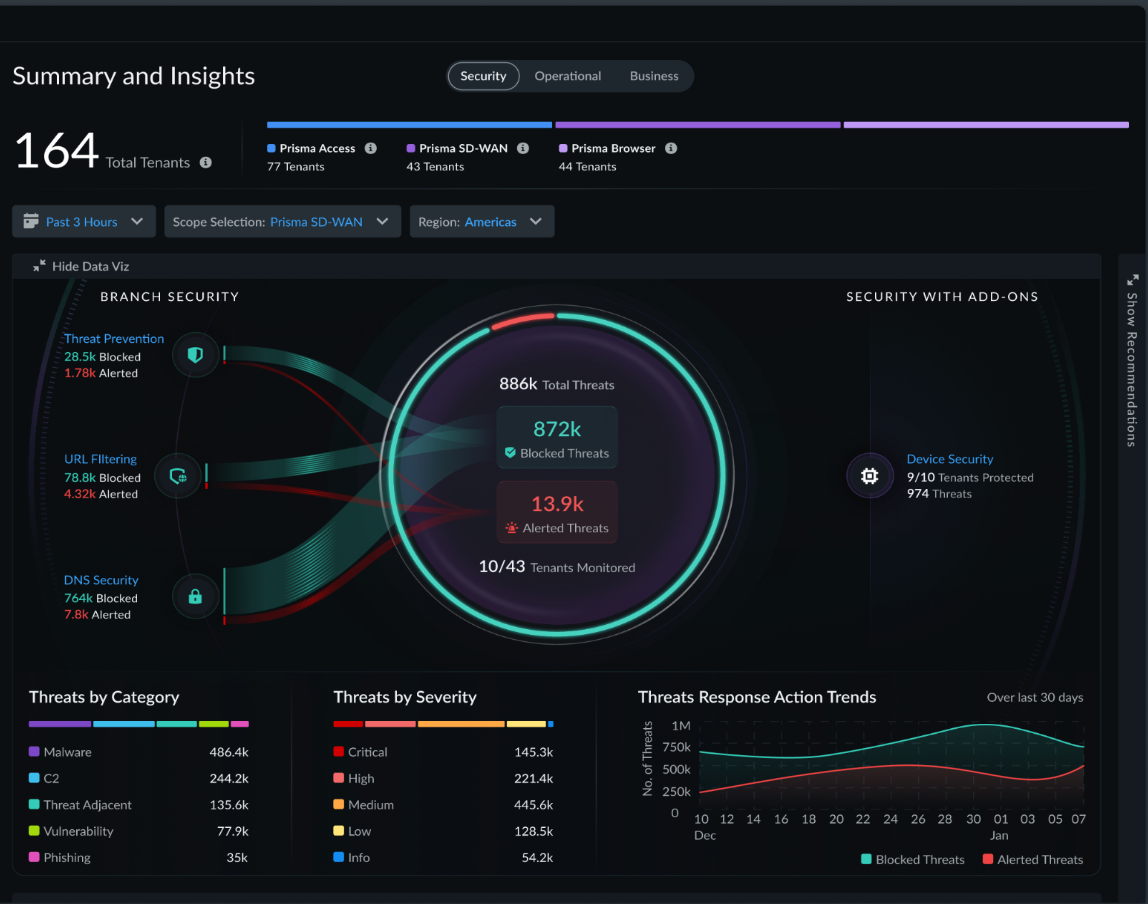
| Threats by Category | Breakdown of threats by type (Malware, C2, Threat Adjacent, Vulnerability, Phishing). |
| Threats by Severity | Distribution of threats across severity levels (Critical, High, Medium, Low, and Informational) showing relative volume for prioritization. |
| Threats Response Action Trends | Time series chart tracking blocked vs. non-blocked threat counts over the past 30 days, showing how the response action split changes over time. |

Tenant Table
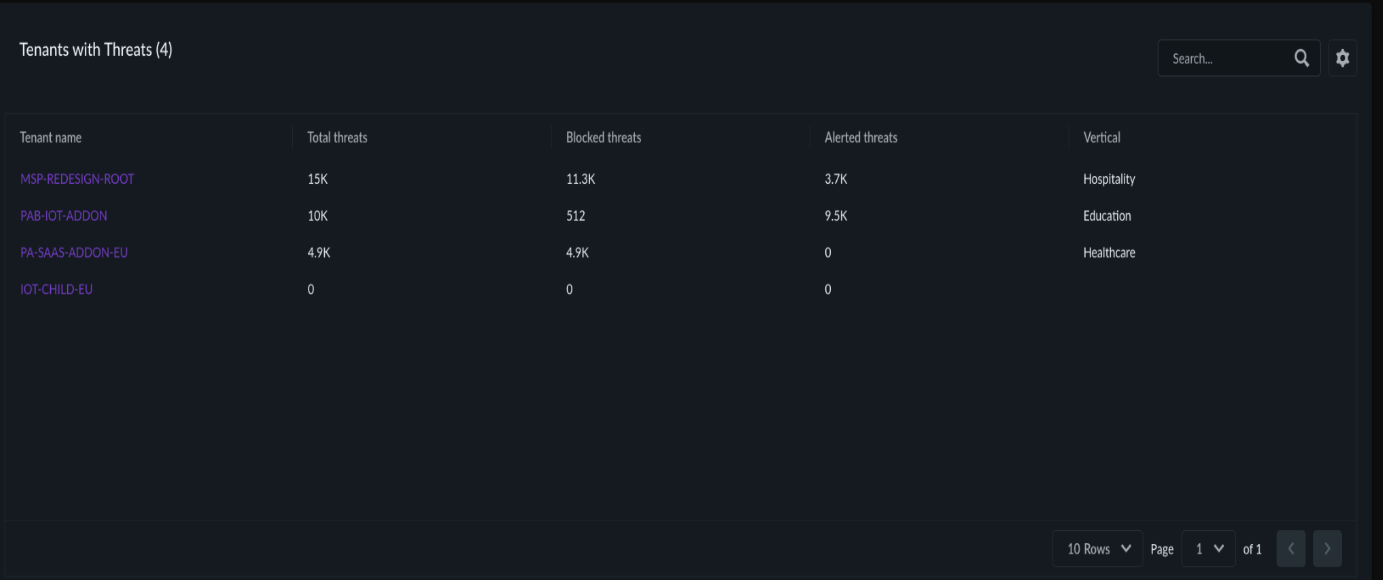
The tenant table for the Prisma Access security view lists each tenant with the following columns:
- Total Threats — Combined count of all threat events for the tenant
- Blocked Threats — Threats that were successfully blocked
- Alerted Threats — Threats that were detected but not blocked (alert-only)
- Vertical — The industry segment of the tenant
For tenants where threats were alerted but not blocked, you can investigate whether the security policy intentionally allows certain traffic (alert-only mode) or whether policy adjustments are needed. Click the tenant to navigate to the single-tenant view and review the relevant policies.
Prisma SD-WAN
When you select Prisma SD-WAN as the scope, the Security view displays branch security data powered by Cloud-Delivered Security Services (CDSS).
When you select Prisma SD-WAN as the scope, the Security view displays branch security data powered by Cloud-Delivered Security Services (CDSS).
Branch Security
These services are available for Prisma SD-WAN tenants with branch security enabled:
| Widget | Description |
|---|---|
| Threat Prevention | Total threats detected and blocked at branch locations. |
| URL Filtering | Malicious URLs identified and blocked at branch sites. |
| DNS Security | DNS-based threats blocked at branches. |
The data is categorized using the same CDSS engine that processes Prisma Access traffic, so the threat categories are consistent across both product lines.
Add-on: Device Security
| Widget | Description |
|---|---|
| Device Security | IoT device threats detected at branch locations. Displays the count of tenants with this add-on activated. |
Prisma Browser
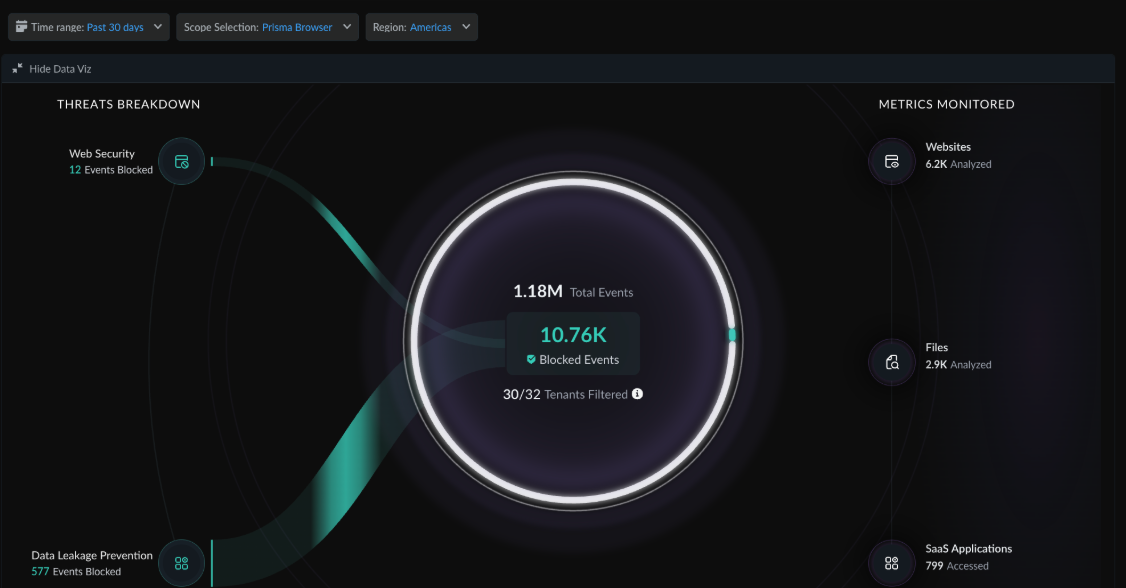
When you select Prisma Browser as the scope, the Security view displays event-based security metrics.
When you select Prisma Browser as the scope, the Security view displays event-based security metrics. In Prisma Browser, all security activity is categorized as events.
Security Events
| Widget | Description |
|---|---|
| Web Security | Total web security events blocked across filtered tenants. |
| DLP (Data Loss Prevention) | Total DLP events blocked. |
Drill-Down Metrics
Below the primary event counts, the view provides deeper context under Metrics Monitored:
| Metric | Description |
|---|---|
| Websites Analyzed | Total number of websites processed by Prisma Browser across filtered tenants. |
| Files Analyzed | Total number of files inspected for threats or policy violations. |
| SaaS Applications Accessed | Total number of SaaS applications accessed through Prisma Browser. |
| Events — Total vs. Blocked | Comparison of total events generated versus events that were successfully blocked. |
These metrics help you understand the volume of activity that contributed to the blocked event counts and identify areas where events were not blocked.
Tenant Table
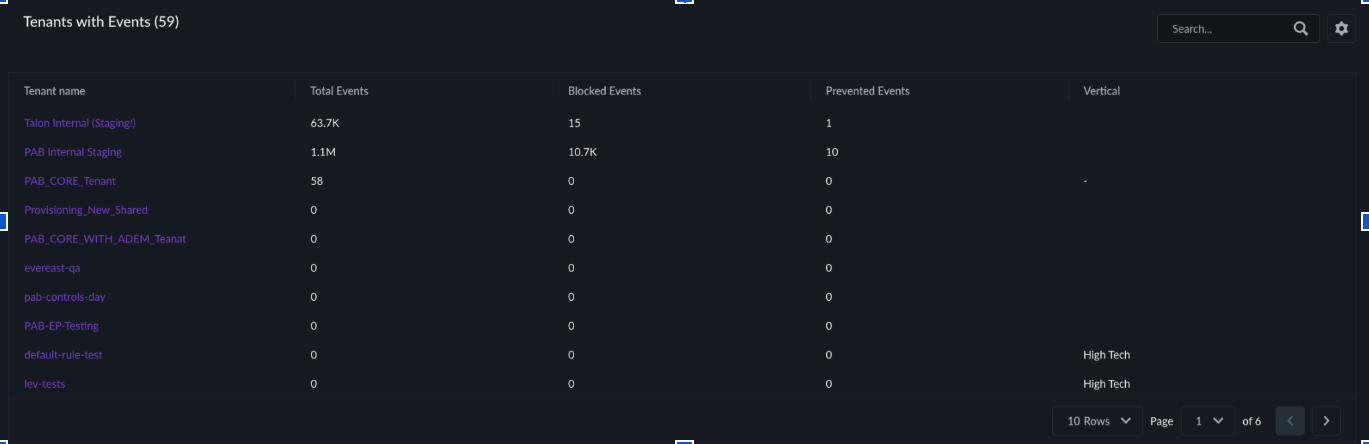
The tenant table shows per-tenant event counts so you can identify which tenants generate the most security events and where blocking actions occurred.