
Prisma SD-WAN
Table of Contents

Prisma SD-WAN
The Prisma SD-WAN operational view focuses on fabric health and device status.
The Prisma SD-WAN operational view focuses on fabric health and device status.
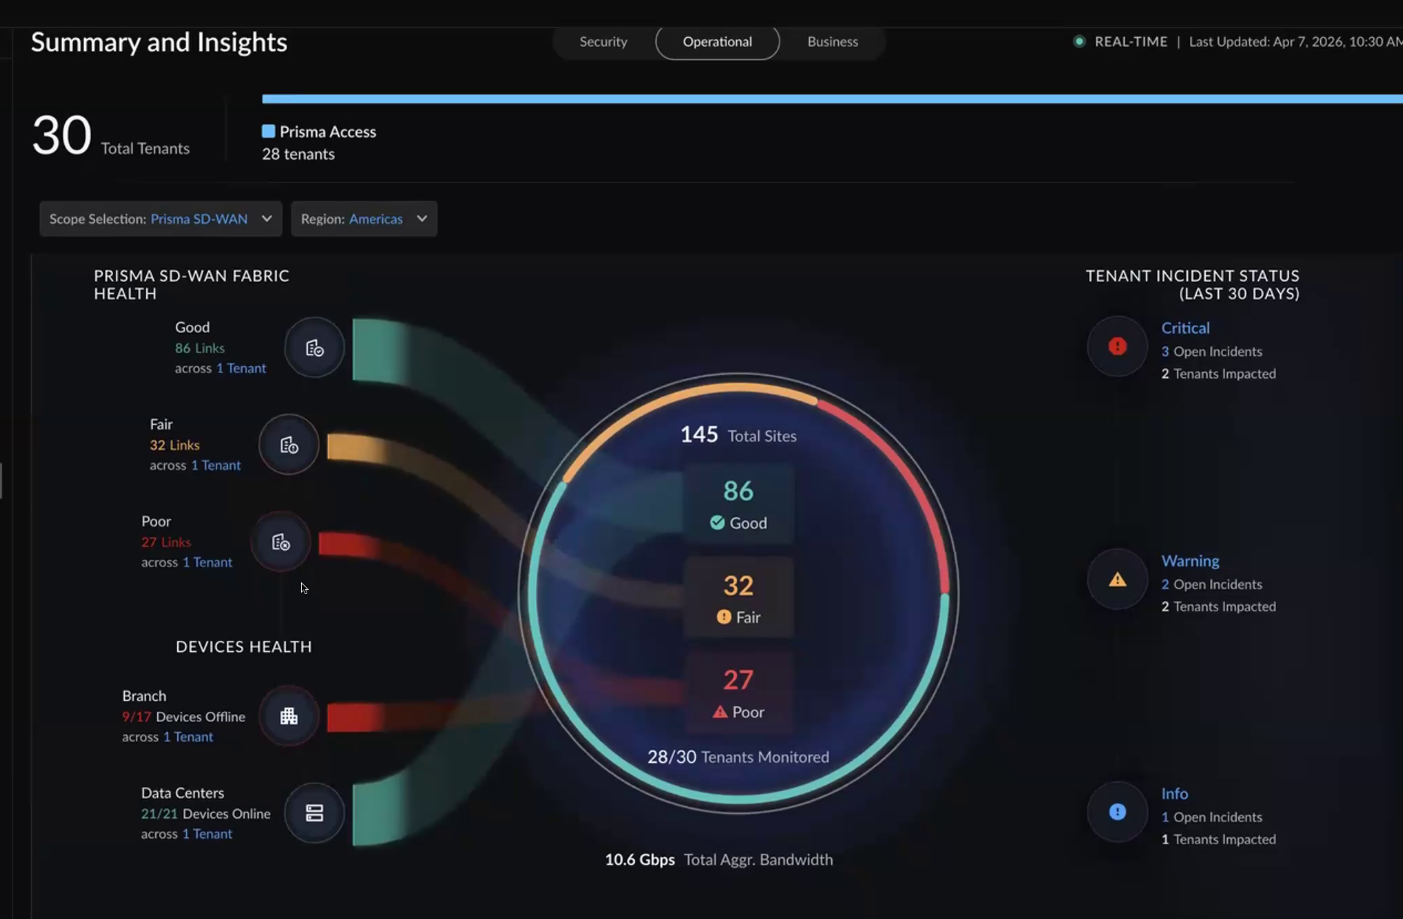
Fabric Health (Links)
The view displays the status of WAN links across all filtered Prisma SD-WAN tenants:
| Status | Description |
|---|---|
| Good | Indicates a health score>80. |
| Fair | Indicates a health score between 60-80. |
| Poor | Indicates a health score<60. |
The total number of links across tenants is displayed along with the breakdown by status category. The categorization of link health as Good, Fair, or Poor is based on performance thresholds. A tooltip on the widget provides details about the classification logic.
Device Health
| Category | Description |
|---|---|
| Branch Devices | Total branch devices with online/offline status. Offline devices require attention. |
| Data Center Devices | Total data center devices with their current status. |
Incidents
Similar to the Prisma Access view, incidents for Prisma SD-WAN tenants are displayed by severity (Critical, Warning, Informational).
Tenant Table
The tenant table provides per-tenant visibility into:
- Branch health (device online/offline status)
- Branch link health (link status breakdown)