Use the Endpoint Security Manager Dashboard
Table of Contents
Expand all | Collapse all
-
- Set Up the Endpoint Infrastructure
- Activate Traps Licenses
-
- Endpoint Infrastructure Installation Considerations
- TLS/SSL Encryption for Traps Components
- Configure the MS-SQL Server Database
- Install the Endpoint Security Manager Server Software
- Install the Endpoint Security Manager Console Software
- Manage Proxy Communication with the Endpoint Security Manager
- Load Balance Traffic to ESM Servers
-
- Malware Protection Policy Best Practices
- Malware Protection Flow
- Manage Trusted Signers
-
- Remove an Endpoint from the Health Page
- Install an End-of-Life Traps Agent Version
-
-
- Traps Troubleshooting Resources
- Traps and Endpoint Security Manager Processes
- ESM Tech Support File
-
- Access Cytool
- View the Status of the Agent Using Cytool
- View Processes Currently Protected by Traps Using Cytool
- Manage Logging of Traps Components Using Cytool
- Restore a Quarantined File Using Cytool
- View Statistics for a Protected Process Using Cytool
- View Details About the Traps Local Analysis Module Using Cy...
- View Hash Details About a File Using Cytool
Use the Endpoint Security Manager Dashboard
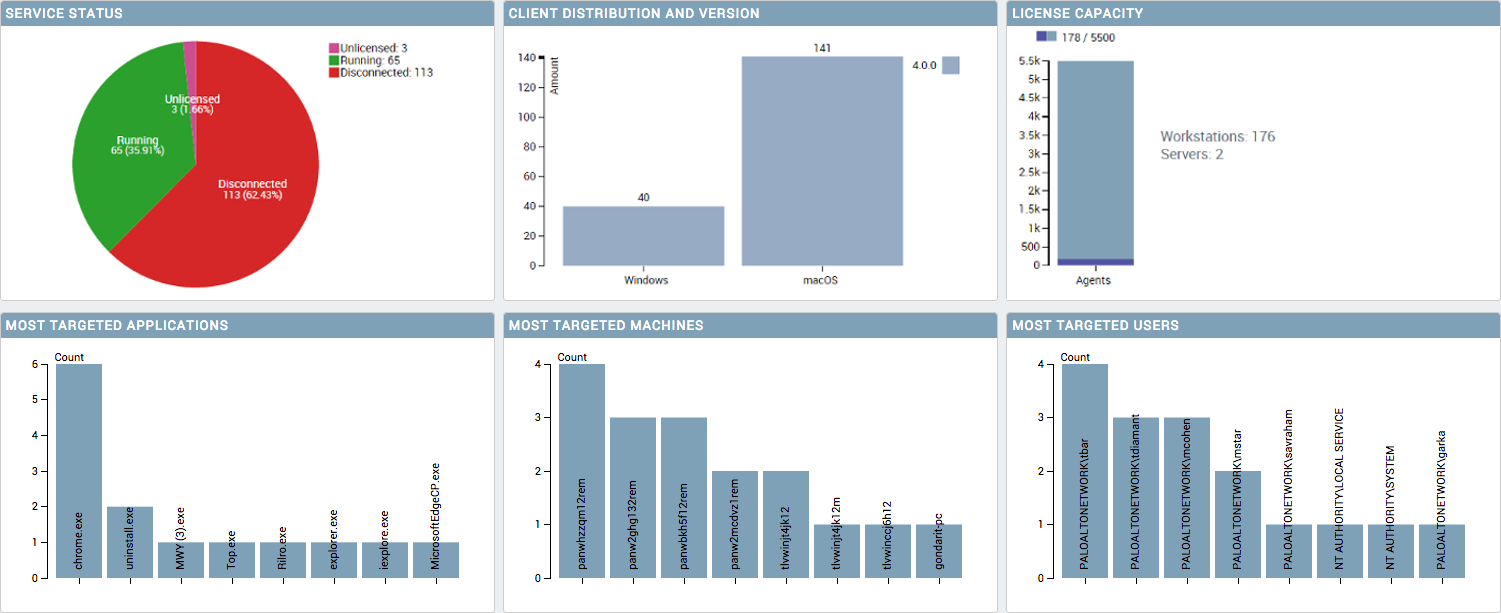
The Dashboard is the first page that you see when you
log into the ESM Console. The Dashboard provides a collection of
charts and graphs that display information about the status of the
Traps agents that are managed by your Endpoint Security Manager.
By default, the ESM Console displays information collected over
the past 30 days. To change the display period, see Manage ESM Console Settings.

The following table describes each chart:
Dashboard Chart | Description |
|---|---|
SERVICE STATUS | Displays the status of the Traps agent instances
installed on the endpoints by number and percentage. Possible statuses
are:
|
COMPUTER DISTRIBUTION AND VERSION | Displays the version of the Traps agent
instances installed on the endpoints by number and percentage. |
LICENSE CAPACITY | Displays the Traps license utilization for
the server and client by number of used and available licenses. |
MOST TARGETED APPLICATIONS | Displays applications that have the highest
distribution of preventions. |
MOST TARGETED COMPUTERS | Displays endpoints that have the highest
distribution of preventions. |
MOST TARGETED USERS | Displays preventions that have the highest
distribution per end user. |
