
Business
Table of Contents

Business
The Business view provides an executive-level view of product adoption, usage, and license management across your entire tenant hierarchy.
| Where Can I Use This? | What Do I Need? |
|---|---|
|
|
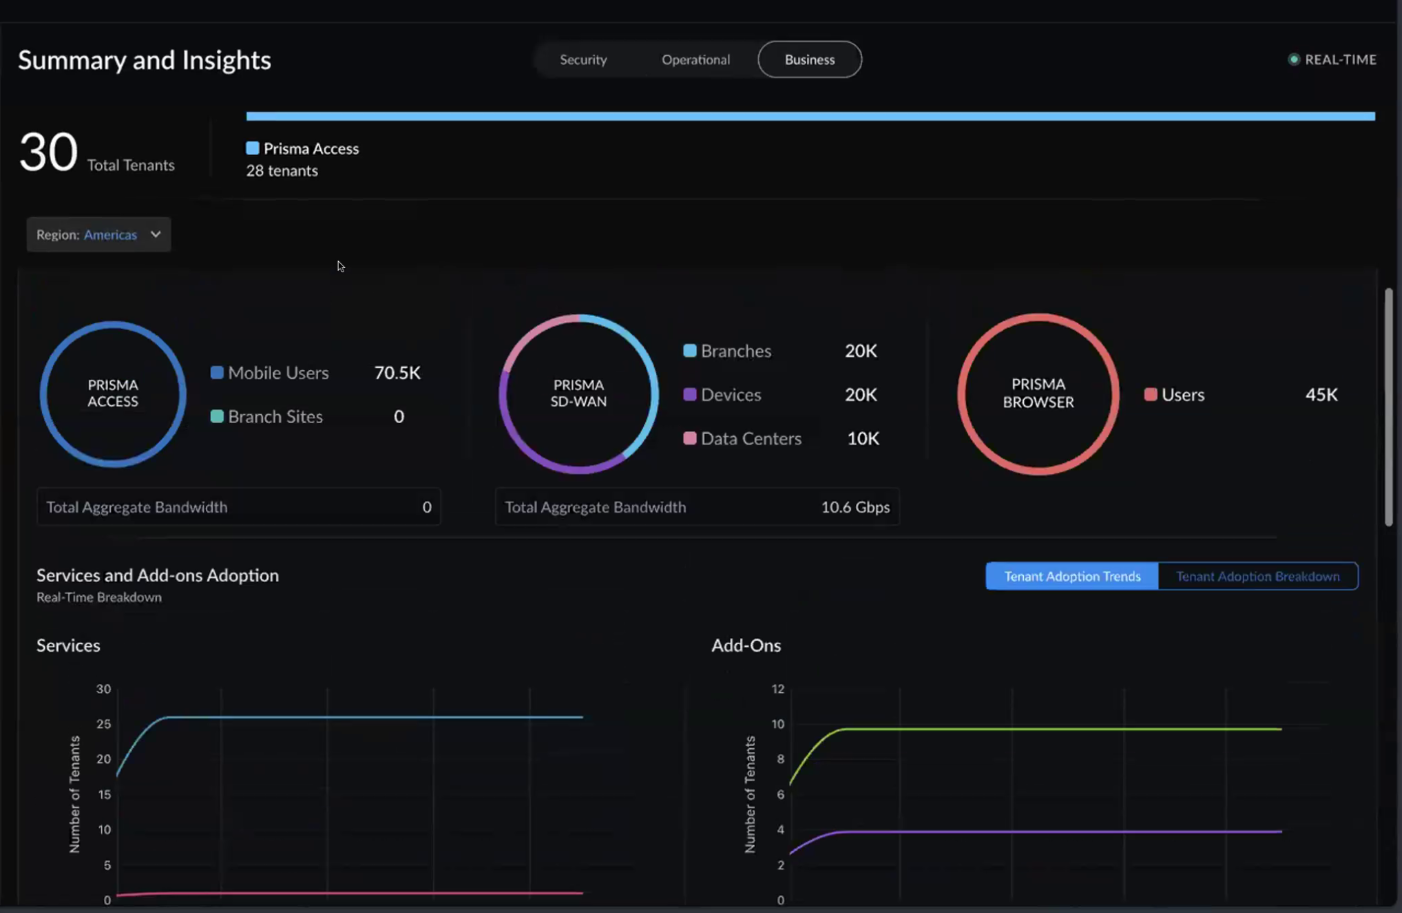
The Business view provides an executive-level view of product adoption, usage, and license management across your entire tenant hierarchy. You can view a consolidated summary of license allocation, availability, and utilization across all tenants. This view does not include product scope selection — it displays all products together for a holistic view. Only the Region filter is available.
Service Overview
The top section provides at-a-glance metrics for each product:
| Product | Metrics Displayed |
|---|---|
| Prisma Access | Total users and branch sites across all tenants. |
| Prisma SD-WAN | Total branches, devices, and data centers across all tenants. |
| Prisma Browser | Total users across all tenants. |

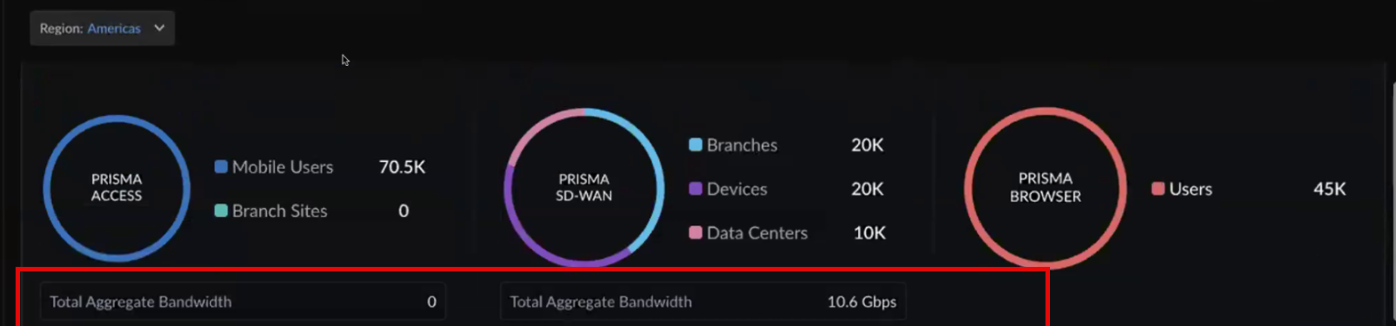
Bandwidth Usage
| Service | Description |
|---|---|
| Prisma Access | The total licensed bandwidth allocated across all tenants based on activation-time allocations. |
| Prisma SD-WAN | Total aggregate bandwidth consumed across all Prisma SD-WAN tenants. |
Usage Trends (Subscription and Add-ons Adoption)
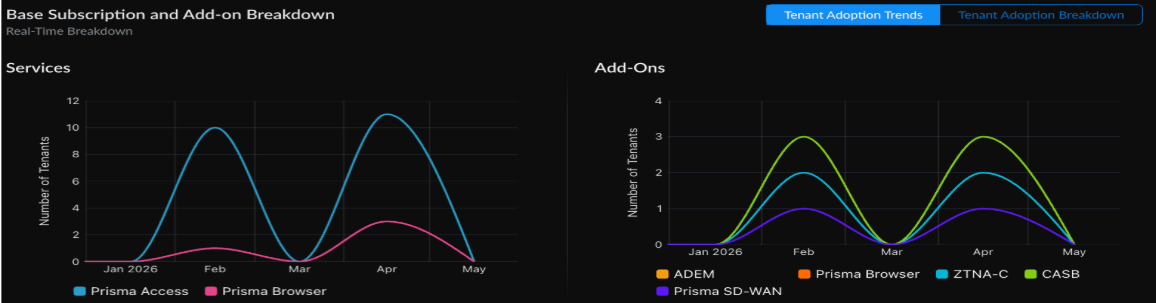
Trend charts show how usage has changed over time (over a 6 month period):
- Services — Tenant adoption trends for Prisma Access, Prisma SD-WAN, and Prisma Browser over time.
- Add-Ons — Tenant adoption trends for add-ons over time.
These charts help you identify growth patterns and anticipate when you may need to expand capacity or adjust license allocations.
Add-on Adoption
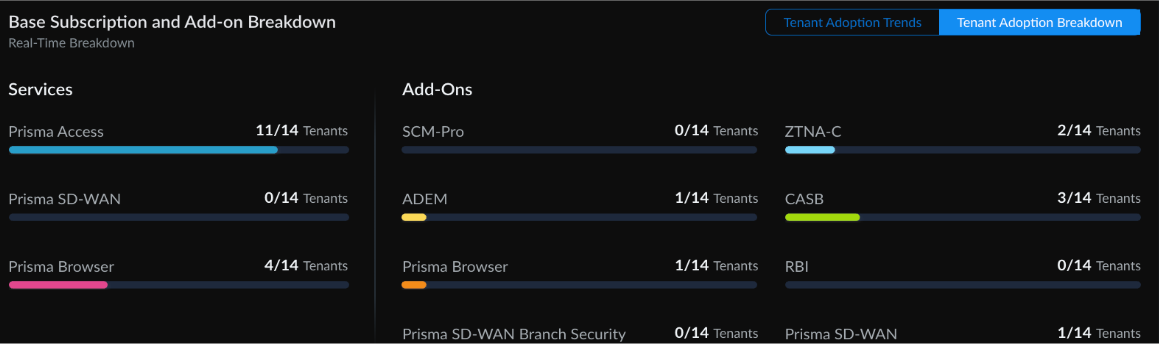
This section shows how many tenants have each add-on activated:
- ADEM
- Strata Cloud Manager Pro
- CASB
- Prisma SD-WAN Branch Security
- ZTNA-C
- Prisma Browser (when activated as an add-on)
- Prisma SD-WAN (add-on activated on a tenant)
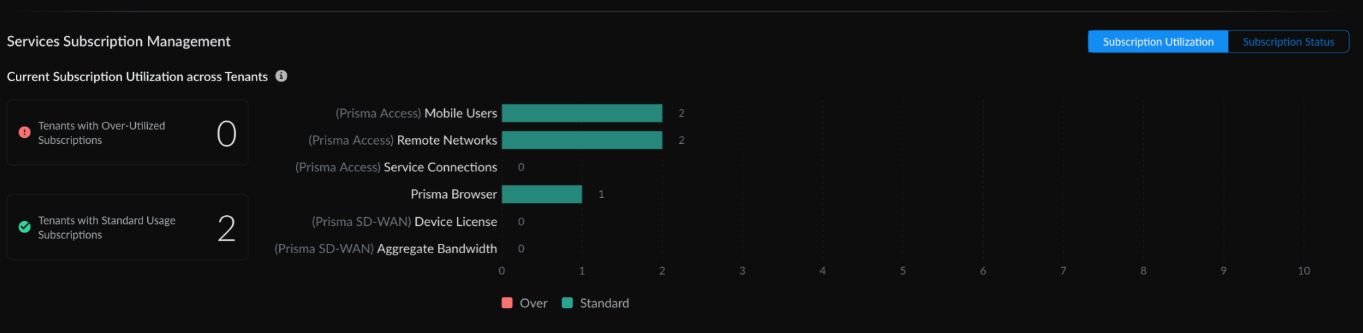
Subscription Utilization
Tracks whether tenants are consuming licenses within their purchased allocation:
| Status | Description |
|---|---|
| Standard | Active usage is within the purchased license quantity. |
| Over-utilized | Active usage exceeds the purchased license quantity. |
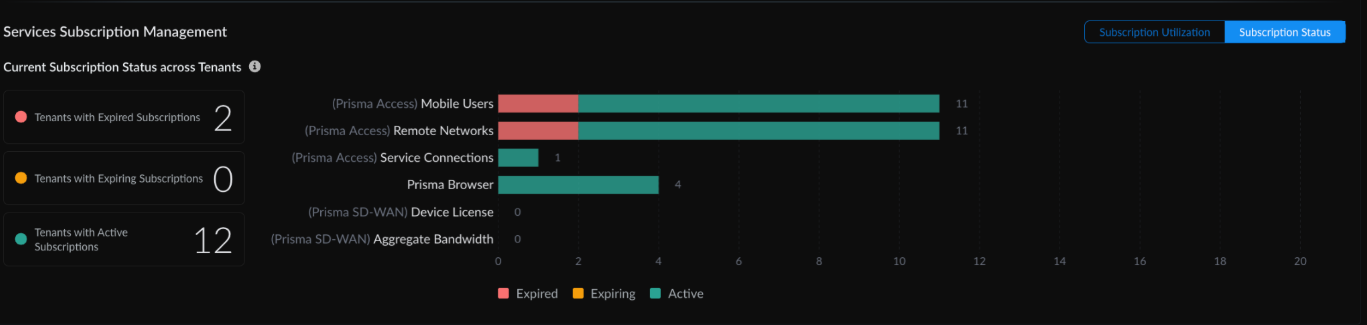
Subscription Status
Tracks the lifecycle of licenses across your tenants:
| Field | Description |
|---|---|
| Subscription Type | Yearly (term-based) or PayGo (monthly postpaid, credit-based) |
| Status | Active, Onboarding In Progress, Onboarding Failed, or Expired |
| Activation Date | When the subscription was activated |
| Expiry Date | Subscription expiration date (countdown shown within 30 days). PayGo tenants show "N/A" as they have no fixed expiry. |
Tenant Table
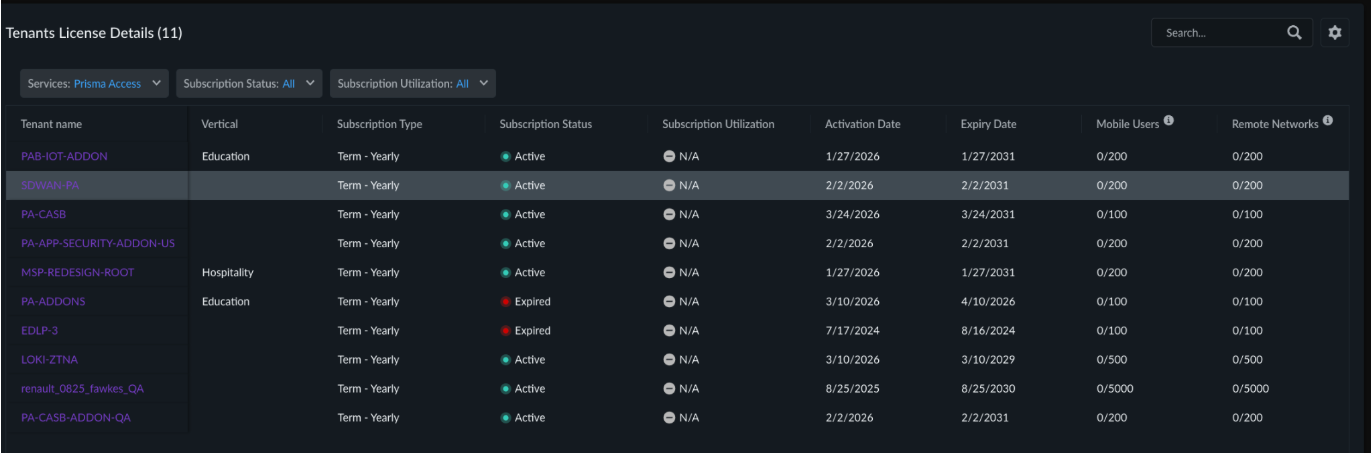
The tenant table includes:
- Tenant name
- Vertical (industry segment)
- Subscription type (Term - Yearly or PayGo - Monthly)
- Subscription status (Active, Onboarding In Progress, Onboarding Failed, or Expired)
- Subscription utilization (Standard, Over, or N/A)
- Package (Prisma Browser, SASE SWG, or SASE ENT — for PayGo tenants)
- Activation date
- Expiry date
PayGo Usage Analytics
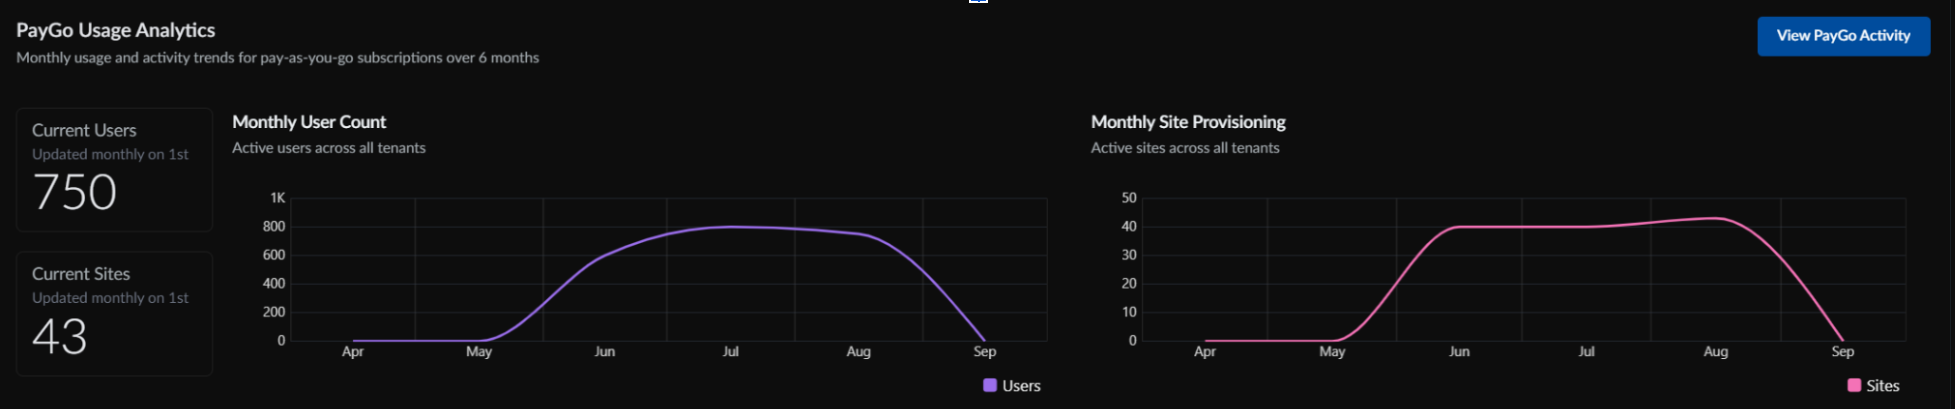
The PayGo Usage Analytics is available only on the absolute root tenant and provides an aggregated view of package activation and provisioning activity across all child tenants.
The dashboard displays PayGo activity trends for the past six months, including:
- Current Users — Total number of users associated with activated packages across all child tenants.
- Current Sites — Total number of active sites across all child tenants.
- Monthly User Count — Number of users with activated packages across all child tenants for each month.
- Monthly Site Provisioning — Number of sites provisioned across all child tenants for each month.
Use the dashboard to monitor consolidated package activation and site provisioning activity across your tenant hierarchy. To manage PayGo tenants, see Activate PayGo Billing Model, Amend a PayGo Tenant, and Deprovision a PayGo Tenant.
Tenant Activity Details (PayGo)
For PayGo tenants, select a tenant from the table to view monthly activity details:
- Mobile User Quantity — Current allocated mobile users for the billing period.
- Remote Network Sites — Number and type of remote network sites provisioned.
- Active Add-ons — Add-ons currently enabled for this tenant.
- Monthly Trend Charts — Allocation changes over time.
- Onboarding Status — Current provisioning state (Onboarding In Progress, Onboarding Complete, or error status).
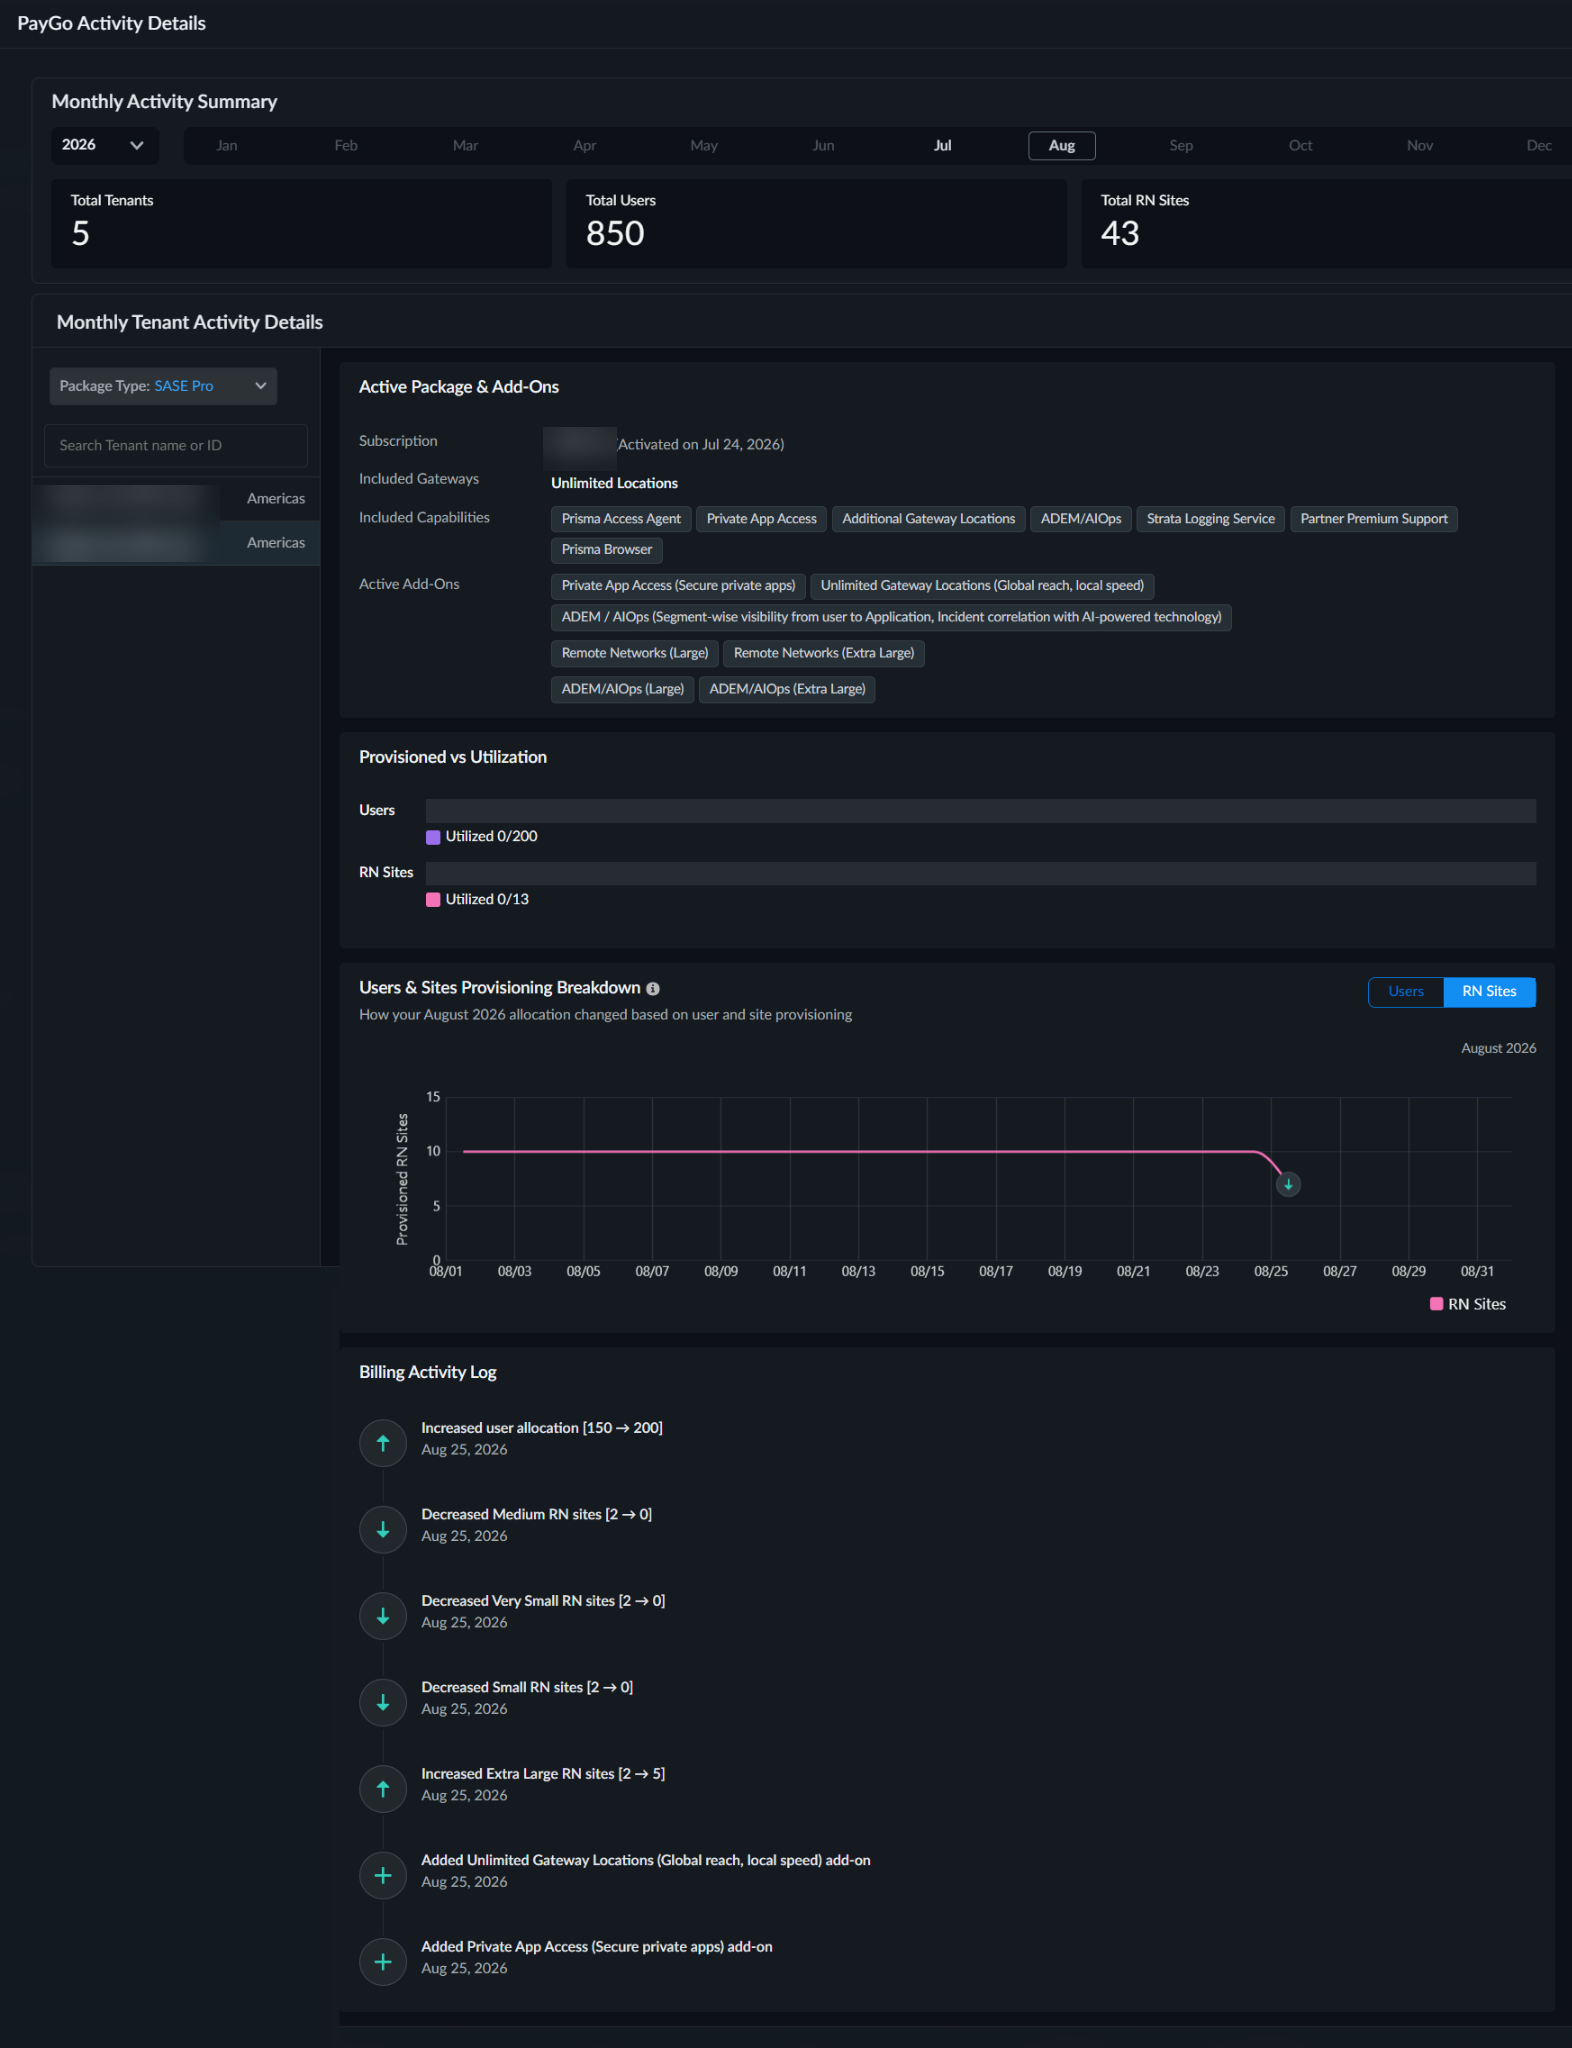
Activity Log
Records all changes made to PayGo tenants:
- Mobile user quantity changes (increases or decreases)
- Add-ons enabled or disabled
- Tenant onboarding and deprovisioning events
- Amendments to tenant configuration
- Provisioning errors (such as activation failure, configuration push failure, or CIE directory lookup failure)
Each log entry includes the timestamp, user, and description of changes. Use the Activity Log to track operational changes, reconcile with billing records, and troubleshoot provisioning issues.