→ The features and capabilities available to you in Strata Cloud Manager depend on which license(s) you are
using.
Monitor how the service connections, ZTNA connectors, and site connectivity are
performing in and Prisma SD-WAN data centers. Select the
InsightsPrisma SASEData CentersService Connections or ZTNA Connectors tab to view the health and status of the service connections
and ZTNA connectors in Prisma Access.
For each Prisma SD-WAN data center, select InsightsPrisma SASEData CentersPrisma SD-WAN to view the site connectivity information and the status of the VPN
overlay connections.
See aggregated service connections data as well as information about individual service
connections. Beyond providing access to corporate resources, service connections allow
your mobile users to reach branch locations. You can view your service connections in
Strata Cloud Manager to see service connection status, bandwidth consumption trends,
tunnel data and trends, and information about overall service connection health. Select
InsightsPrisma SASEData CentersService Connections to get started.
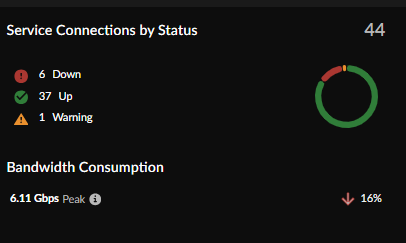
Service Connections by Status
You can view the health status of all your service connections. The color-coded chart
shows you a distribution of how many service connections are up, down, or need
attention. You can view a synopsis of the bandwidth your service connections
consumed in the last 30 days.
Bandwidth Consumption shows the highest peak bandwidth
consumed by a site across all sites for the per-site bandwidth allocation model. The
peak values are computed for the selected time filter duration.
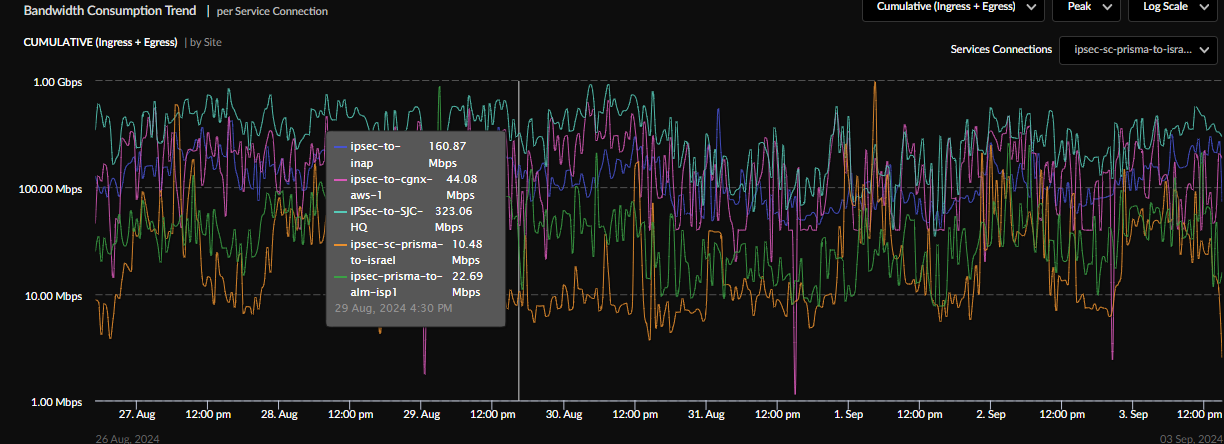
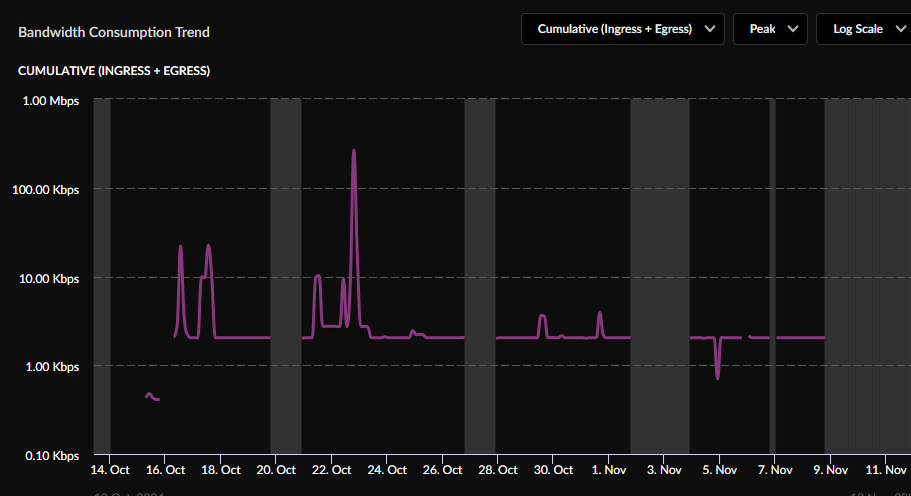
Bandwidth Consumption Trend
View Bandwidth Consumption Trend per Service Connection. The
trend shows the bandwidth consumption by each of your service connections, as well
as their average and peak utilizations.
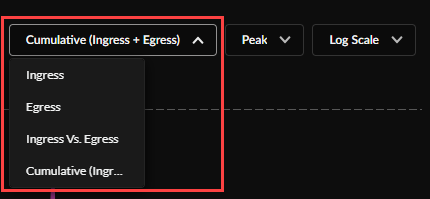
The default view shows Cumulative (Ingress + Egress)
bandwidth consumption. Other options are Ingress,
Egress, or Ingress vs.
Egress.
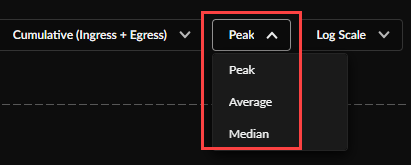
View the Peak, Median, or
Average bandwidth consumption trend during the
selected time range. The default setting is Peak
bandwidth consumption.
Log Scale or Linear Scale.
Select 1 to 10 Service Connections to view their trend
lines on the graph during the selected time range. Hover over the graph to
information about each of the service connections you selected.
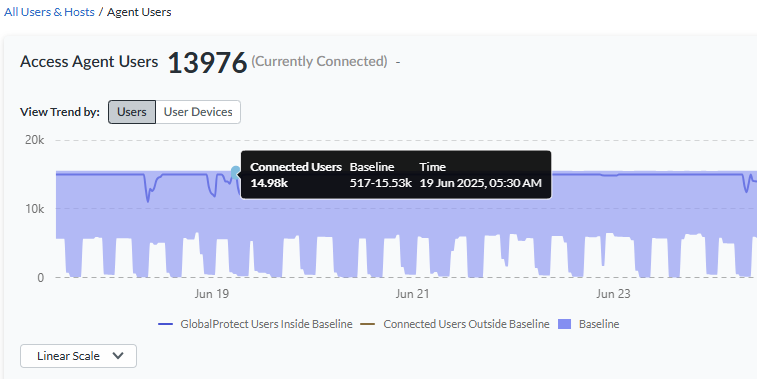
Baselines in Widgets
If you purchased the AI-Powered ADEM license, you see a baseline data band
across the trend widgets on the following Monitor pages: Users, Branch Sites, Data
Centers, and Network Services. The widgets show the baseline in the background
across the trend lines. This allows you to view at a glance whether your data has
crossed the upper or lower boundaries of the baseline.
Baseline data is calculated in 1-hour bin sizes and takes into consideration the last
28 days of data from those hour-long bins for a particular tunnel, site, Prisma Access location, or GlobalProtect user count. For example, the baseline
from 1:00 pm to 2:00 pm on Tuesday is calculated from the 1:00 pm to 2:00 pm time
frame on the previous four Tuesdays. The lower bound is the 10th percentile of that
historical data collected, and the upper bound is its 90th percentile. This allows
you to see trends for bandwidth, user counts, authentication counts, and DNS Proxy
request and response. Because the baseline data is taken from the last 28 days of
historical data, the newly onboarded tenants will need to be up and data rich for 28
days for the baseline to be calculated correctly. If your data is less than 28 days,
you may see some discrepancies.
When the values in the trend line in the widget deviate from the baseline's upper or
lower limits, the trend line for that period appears in red in the web
interface.
The following example shows the GlobalProtect baseline from the Connected
User widget on the Users page.
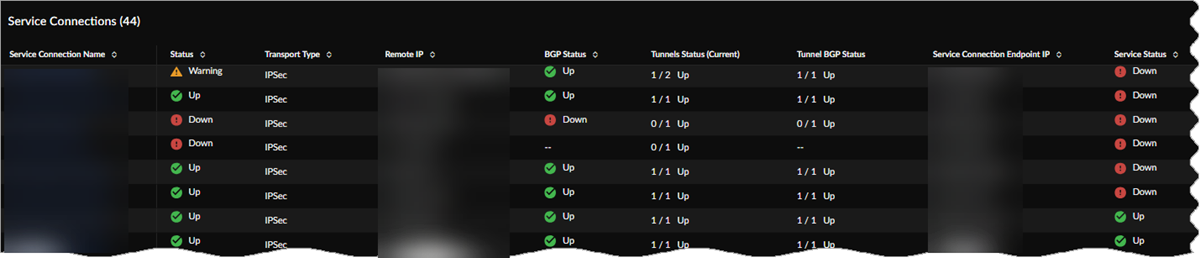
Service Connections Table
The Service Connections table shows you data about your
service connections, such as the status, the remote IP address, BGP status, current
tunnel status, and other data. Select a Service Connection
Name for details about that service connection.
Service Connection Name—The service connection's unique
name.
Site Status—Up, Down, Warning, or
Unknown.
Transport Type—IPSec.
Remote IP—The remote IP address.
BGP Status—Whether the site BGP status is Up,
Down, or Unknown.
Tunnels Status—The number of the site's tunnels and how many of those
tunnels are up.
Tunnel BGP Status—The BGP status for each tunnel.
Service Connection Endpoint IP—The service connection's endpoint IP
address.
Service Status—This field indicates the status of the instance or
firewall to which the site is connected. The status can be
Up, Down, or
Unknown.
Prisma Access Location—The service connection's Prisma Access
location.
Average Bandwidth Consumption—Average bandwidth
consumption in Kbps.
Peak Bandwidth Consumption—Peak bandwidth consumption in
Kbps.
Service Connection Details
Select any Service Connection Name to view its details. View
its Service Connection Status, Bandwidth
Consumed during the last 30 days. The Bandwidth
Consumption Trend chart shows bandwidth consumption by each of your
service connections during the selected time range.
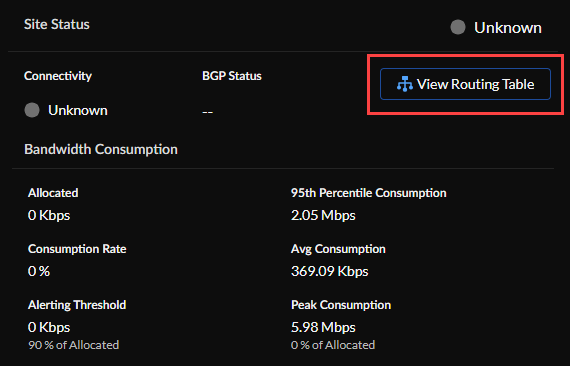
Site Status
Select any Service Connection Name to view its
Site Status, where you can see its
Connectivity and BGP Status
(Up, Down,
Inactive, or Not Available).
View the bandwidth Peak Consumption for the selected time
interval.
Route Table Visibility
To help you address reachability challenges, we offer visibility into the
route table at each service connection. You can perform a route table search
for a destination IP address to determine whether there is a route available
to reach the desired destination. With this information, you can receive
guidance from your Prisma Access infrastructure to investigate other
potential causes of failure. This knowledge allows you to focus your efforts
on resolving any issues affecting reachability.
Select View Routing Table to see this branch's
Routing Table, which has IP routes for
destinations available at the branch from Prisma Access.
Use the search bar to select the destination or look up the
route.
Use the drop-down to filter by Flag.
The routing table shows:
#—Route number
Destination—IP address and subnet of the
reachable network.
Next Hop—IP address of gateway at the next
hop toward the destination network. A next hop of 0.0.0.0 indicates
the default route.
Metric—Metric for the route determined by the
routing protocol.
Flag—Information for this route, as
follows:
A B—Active and learned from BGP.
A C—Active and connected.
Destination—network.
A H—Active and connected.
Destination—host only.
A R—Active and learned from RIP.
O1—OSPF external type-1.
O2—OSPF external type-2.
Oi—OSPF intra-area.
Oo—OSPF interarea.
S—Inactive and static.
A S—Active and static.
Bandwidth Consumption Trend
The Bandwidth Consumption Trend shows
Cumulative (Ingress + Egress) information by
default.
Use the drop-down to view the bandwidth consumption chart by
Ingress, Egress,
Ingress Vs. Egress, or Cumulative
(Ingress + Egress).
View the Bandwidth Consumption Trend chart metrics by
Peak (default), Average,
or Median for the branch site.
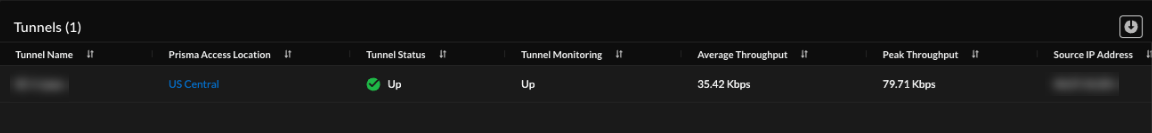
Tunnels
See how many Tunnels there are for this service connection,
and view each tunnel's details. To download Tunnels data,
select the Download icon.
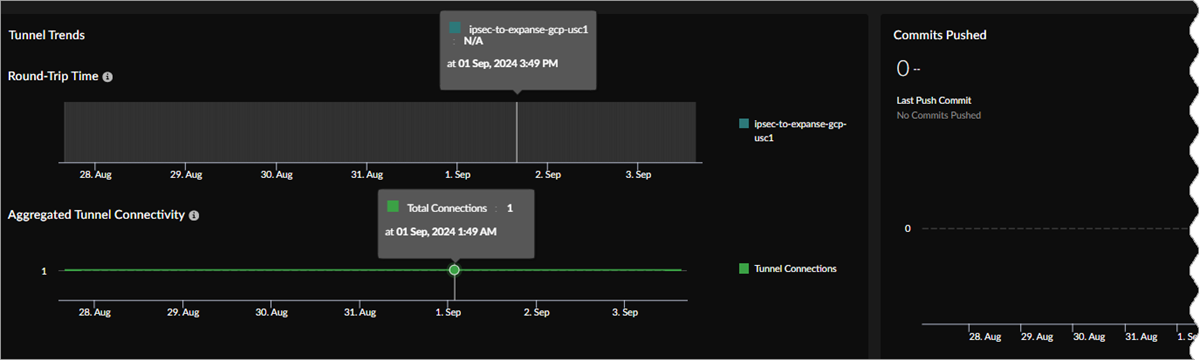
Tunnel Trends
You can select a number of tunnels and view their median Round-Trip
Time. If you don’t specify a set of tunnels, the median RTT is
computed for the 10 tunnels with the highest observed RTT.
Aggregated Tunnel Connectivity shows you the total number of
connected tunnels for the selected time range. Hover over either graph to see the
number of connections at a specific time.
Commits Pushed shows how many commits have been pushed during
the selected Time Range and when the Last Push
Commit occurred.
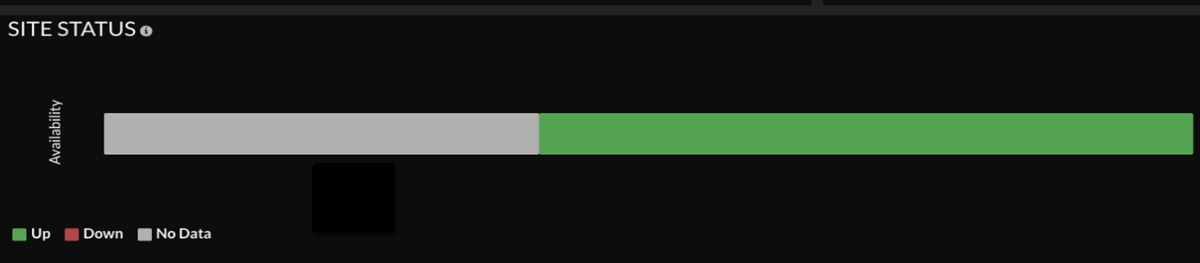
Site Status
Site Status shows site availability during the time range
selected. Green means the site was up during this time, red means the site was down,
and gray means no data was available during the time shown.
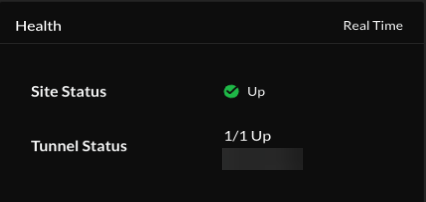
Health
Health shows you the Site Status, and
it shows the name and status of each tunnel in the site.
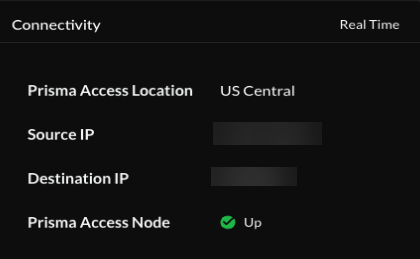
Connectivity
Connectivity shows the Prisma Access location the site is
connected to, its source and destination IPs, and the Prisma Access node
status.
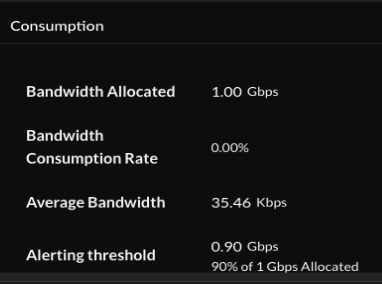
Consumption
Consumption shows bandwidth consumption details.
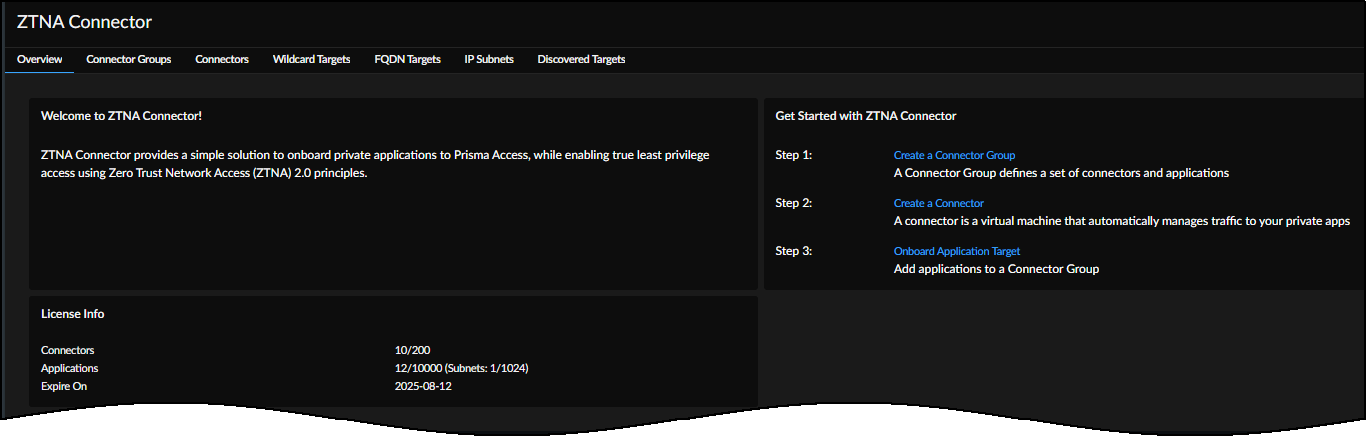
Configuration: ZTNA Connectors
View and monitor ZTNA Connectors to see the status and performance of your ZTNA
connectors and connector groups.
Zero Trust Network Access (ZTNA) Connector simplifies private application access for all
your applications. The ZTNA Connector VM in your environment automatically forms tunnels
between your private applications and Prisma Access. View a summary of all
configured ZTNA connectors, including the Application Targets
associated with the connector, its average and median bandwidth, and the
Status (Up, Partially Up, or Down). Select in Strata Cloud Manager to see how your ZTNA connectors and connector
groups are performing.
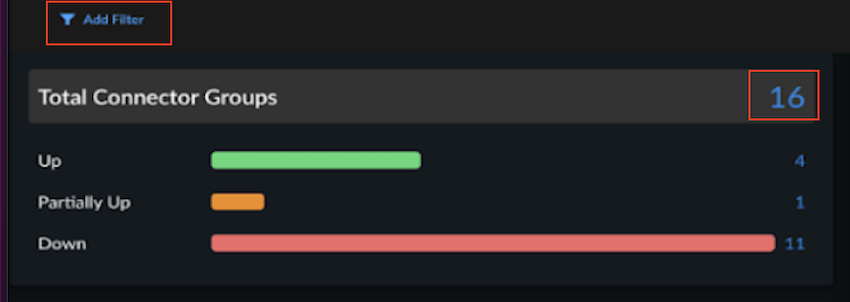
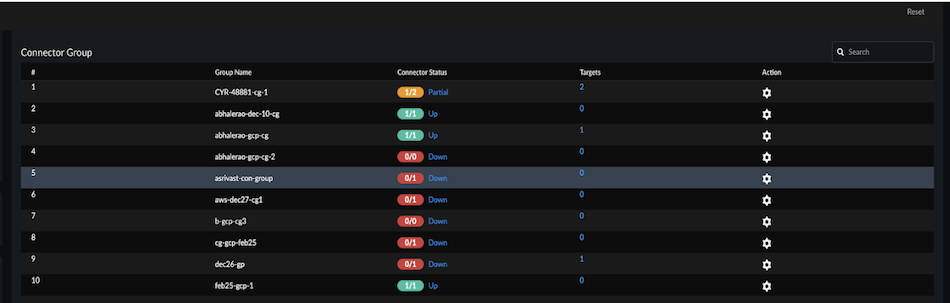
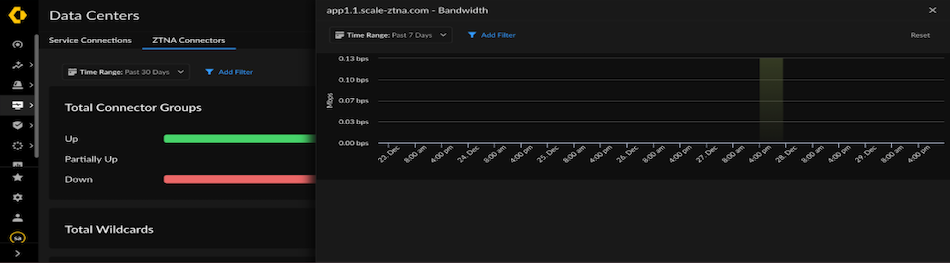
Total Connector Groups
Select the Total Connector Groups to get the details about the
Connector Groups and the associated Connectors. You can filter the information
using:
Time Range: Select and available range or use a custom range.
PA Location: Select the location as per your requirement.
Connector Group: List of available Connector Groups.
Status: Select either Up, Down or Partially
Up.
If all Connectors in a Connector
Group are up, the Status is
Up (green).
If all the Connectors are down, the status is
Down (red).
If some Connectors are up and some are down, the
Status is Partially Up
(orange).
Disabled Connectors appear as gray.
On the right-side of the screen, you get the details such as Group Name,
Connector Status, Targets for the Connector Group.
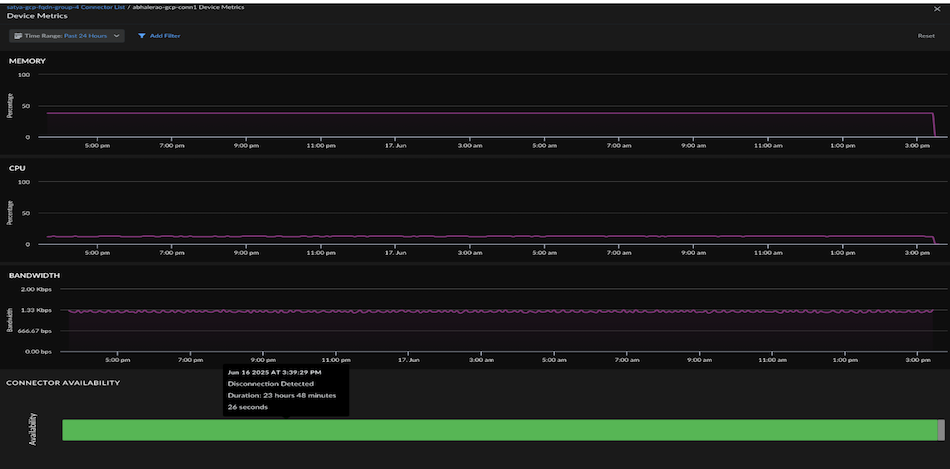
Select Connector Status and then
Action, to get the Device Metrics
(Memory, CPU, Bandwidth, and Connector Availability).
Select Target to get the following details such as
Target, Status, FQDN/IP Subnet, and Enabled.
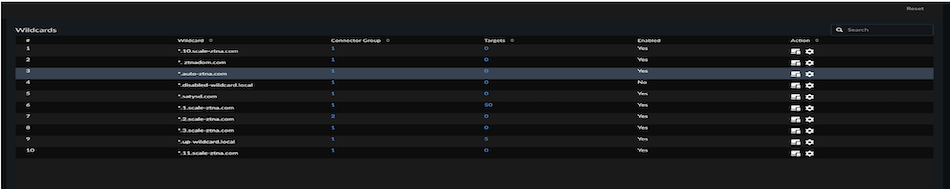
Total Wildcards
Wildcards—For wildcard-based apps, create an FQDN-based Connector Group, and
then, specify the wildcard to use (for example, *.example.com) for the app target.
When users access sites that match the wildcard, those apps are automatically
onboarded for access from ZTNA Connector for your mobile users and remote network
users.
Total Wildcards summarizes how many Wildcard rules you have onboarded. This is the number of wildcard rules that you
created, which is a different total than the number of apps discovered as
a result of creating these rules. Select the number next to Total
Wildcards to get the following details such as Wildcard,
Connector Group, Targets, and Enabled.
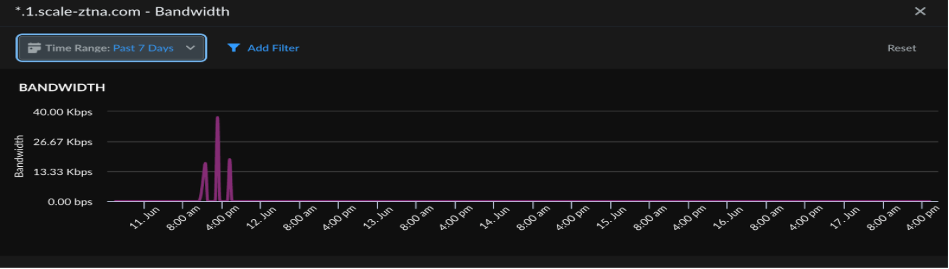
Select Action to
get the bandwidth.
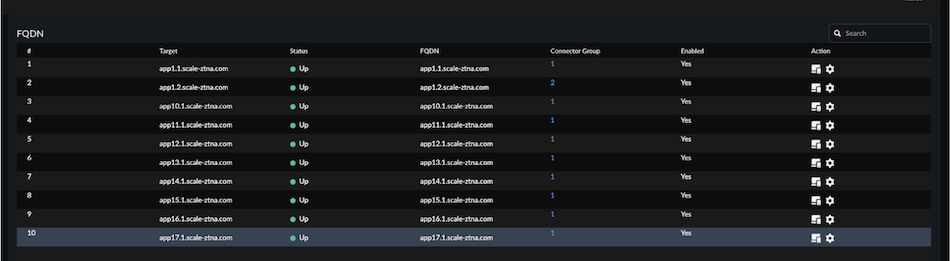
Target
FQDNs—Prisma Access resolves the FQDNs of the applications you onboard to
ZTNA Connector to the IP addresses in the Application IP address block.
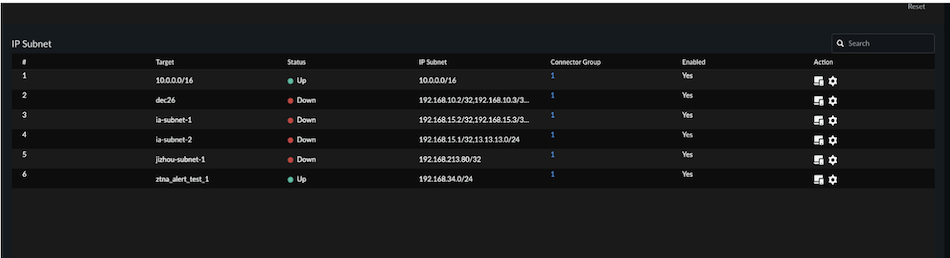
IP Subnets—Create an IP subnet-based Connector Group, and then enter the IP
subnet to use for the app target.
Select the number to view the total number of FQDNs and get
the details such as Target, Status, FQDN, Connector
Group, and Enabled.
Select Action to get the bandwidth.
Select the number to view the total number of IP Subnet and
get the details such as Target, Status, IP Subnet,
Connector Group, and Enabled.
Data Centers (Prisma SD-WAN)
View data centers information in Prisma SD-WAN.
Prisma SD-WAN sites include data centers that you wish to have in
your wide area network. You can host enterprise applications and services in a data
center. As part of creating a data center, you can select a default domain and policy
set, set up WAN networks, circuit categories, circuit labels, and circuit
specifications. The Prisma SD-WAN Data Center screen displays the list of data
centers with the data center name, the ION device, and any open alarms for the site.
The Overlay Connections tab shows you the status of all
VPN overlay connections. Each site's connectivity is computed based on the
status of its VPN overlay connections.