SaaS Security
Monitor Scan Results on the Dashboard
Table of Contents
Monitor Scan Results on the Dashboard
Review the scan results reported by Data Security
on a single dashboard.
| Where Can I Use This? | What Do I Need? |
|---|---|
|
Or any of the following licenses that include the Data Security license:
|
Review the scan results reported by Data Security
on a single dashboard.
Monitor Scan Results
As Data Security starts scanning the sanctioned SaaS applications, the
Dashboard presents a summary of the scan in
eight panes. Each of these panes displays a summary of
information discovered during application scanning. Widgets are interactive, so you
can click screen objects within a widget to drill down into more detailed
information.
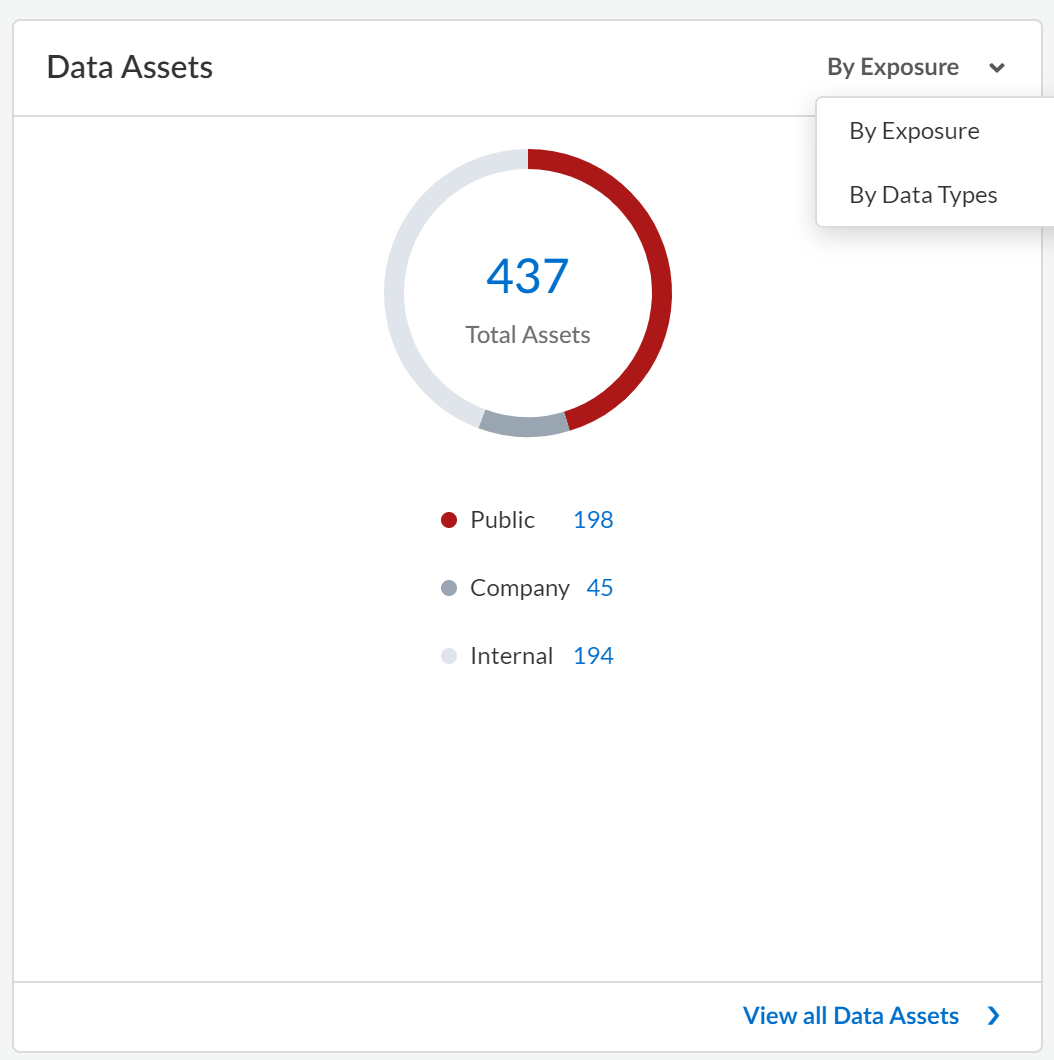
- Data AssetsThis widget displays summary information about assets discovered during scanning.By Exposure: Hover your mouse over the pie chart or click the Public, Company, External, or Internal links to view all data assets under their respective exposure category.By Data Types: Hover your mouse over the pie chart or click the txt, docx, csv or other data types to view the data assets under their respective data type category.Click View All Data Assets to open the Data Assets page to display all assets (without any filters).
![]()
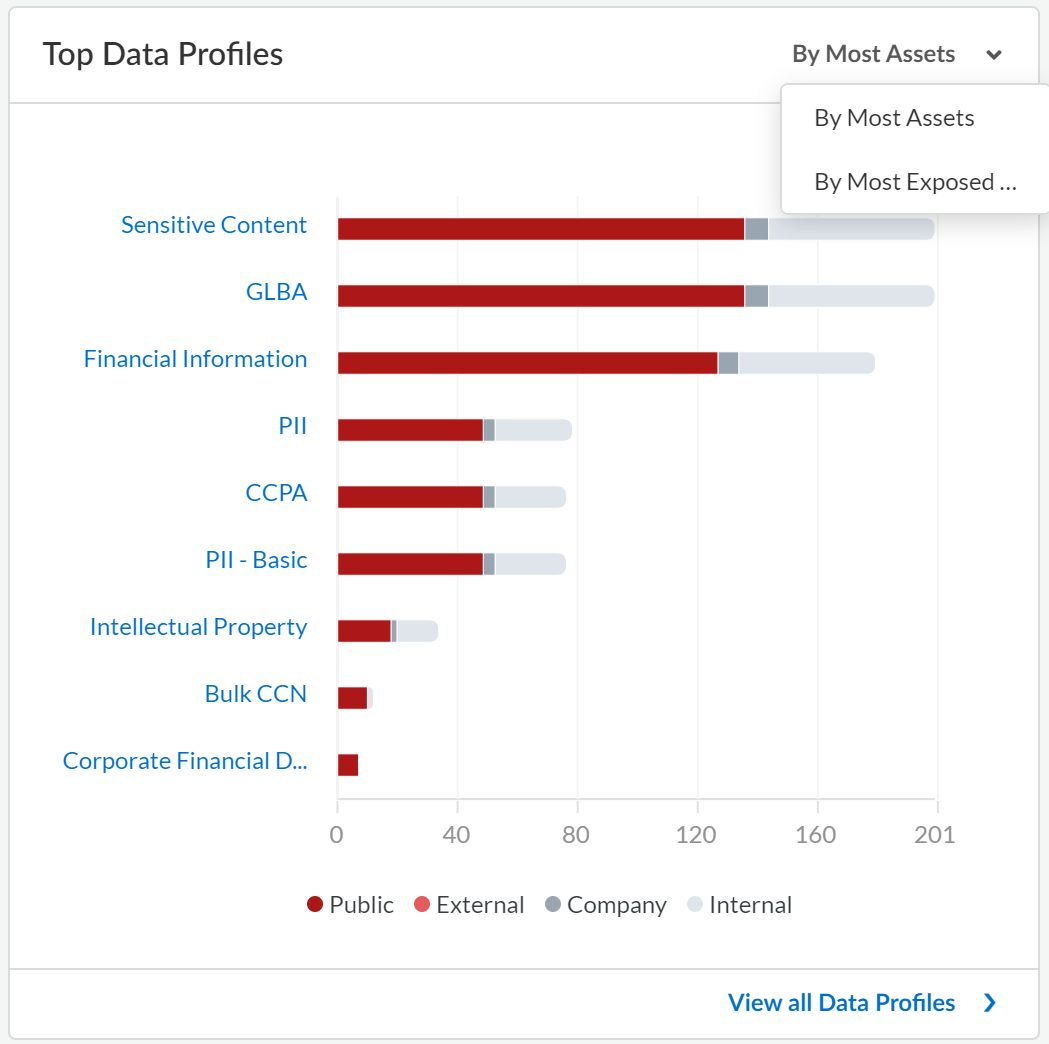
- Top Data Profiles
This widget displays the data profiles and the categories under which they are exposed. In the example given below, hover your mouse over the Sensitive Content bar to view the numbers for Public, Company, Internal, and External exposure types.Choose By Most Assets to view the data profiles with most assets (from top to bottom). Choose By Most Exposed Assets to view the data profiles with the highest number of exposed assets (from top to bottom). Click on a data profile to view all assets in that specific category in the Data Assets page.
![]()
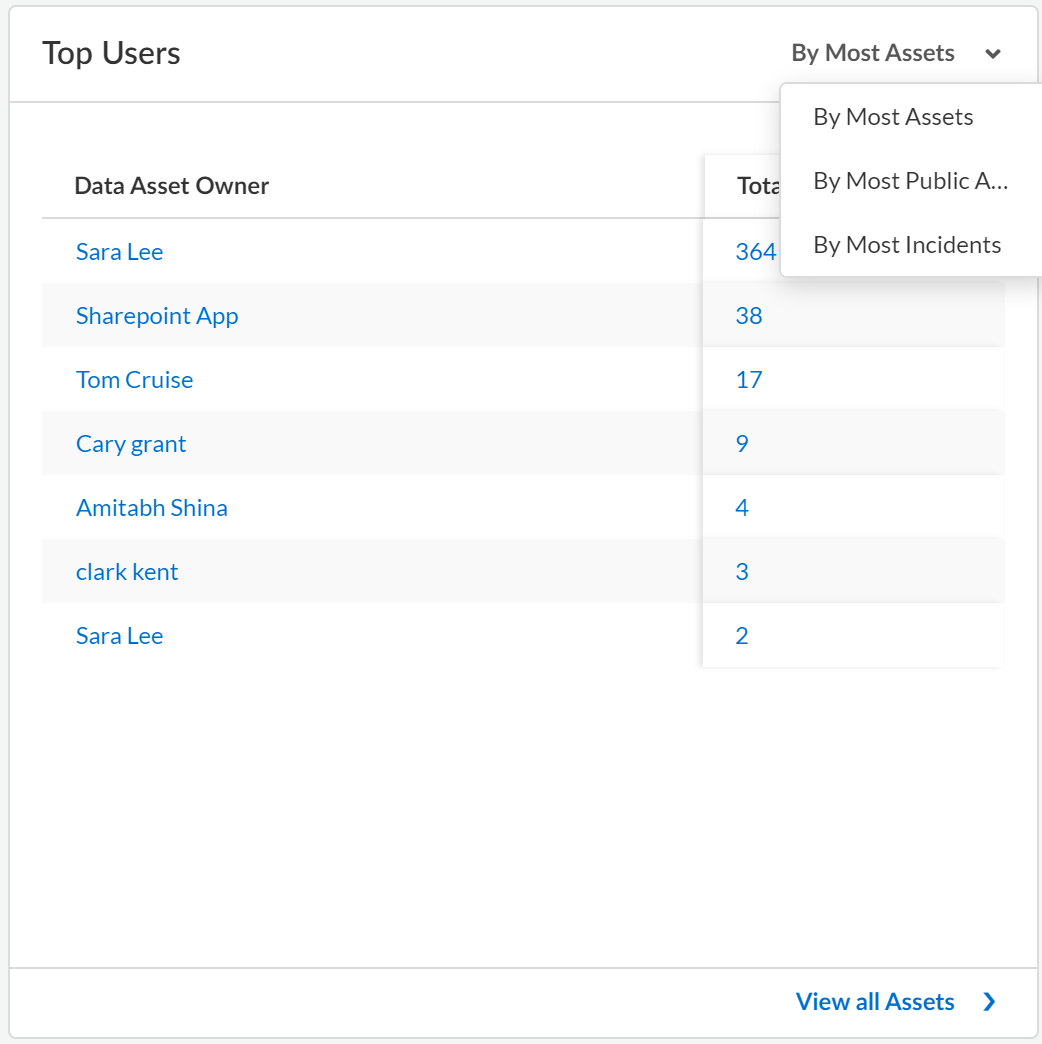
- Top UsersThis widget displays the top data asset owners. Use the following filters to get a more granular data.
- By Most Assets
- By Most Public Assets
- By Most Incidents
![]()
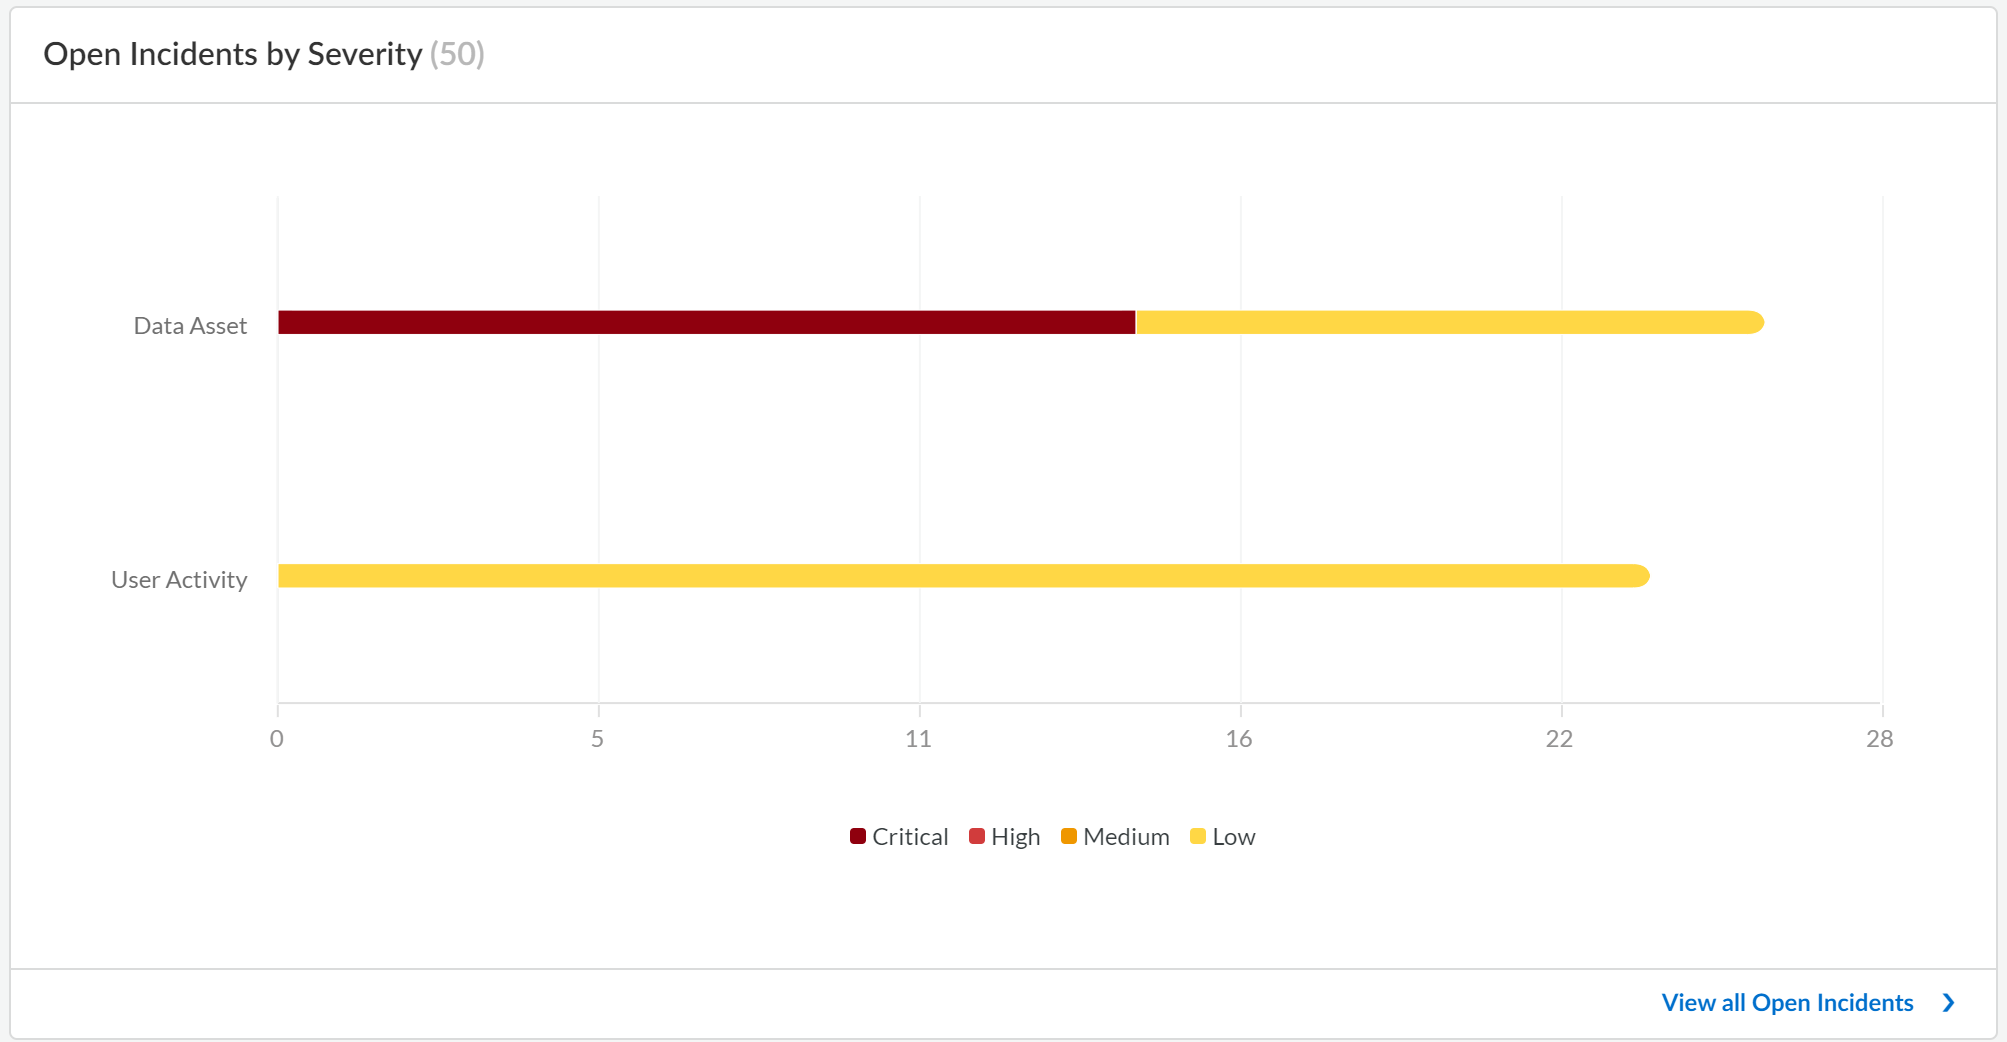
- Open Incidents by SeverityThis widget displays the open incidents categorized according to their severity. Use the following filters to get a more granular data.
- Critical
- High
- Medium
- Low
![]()
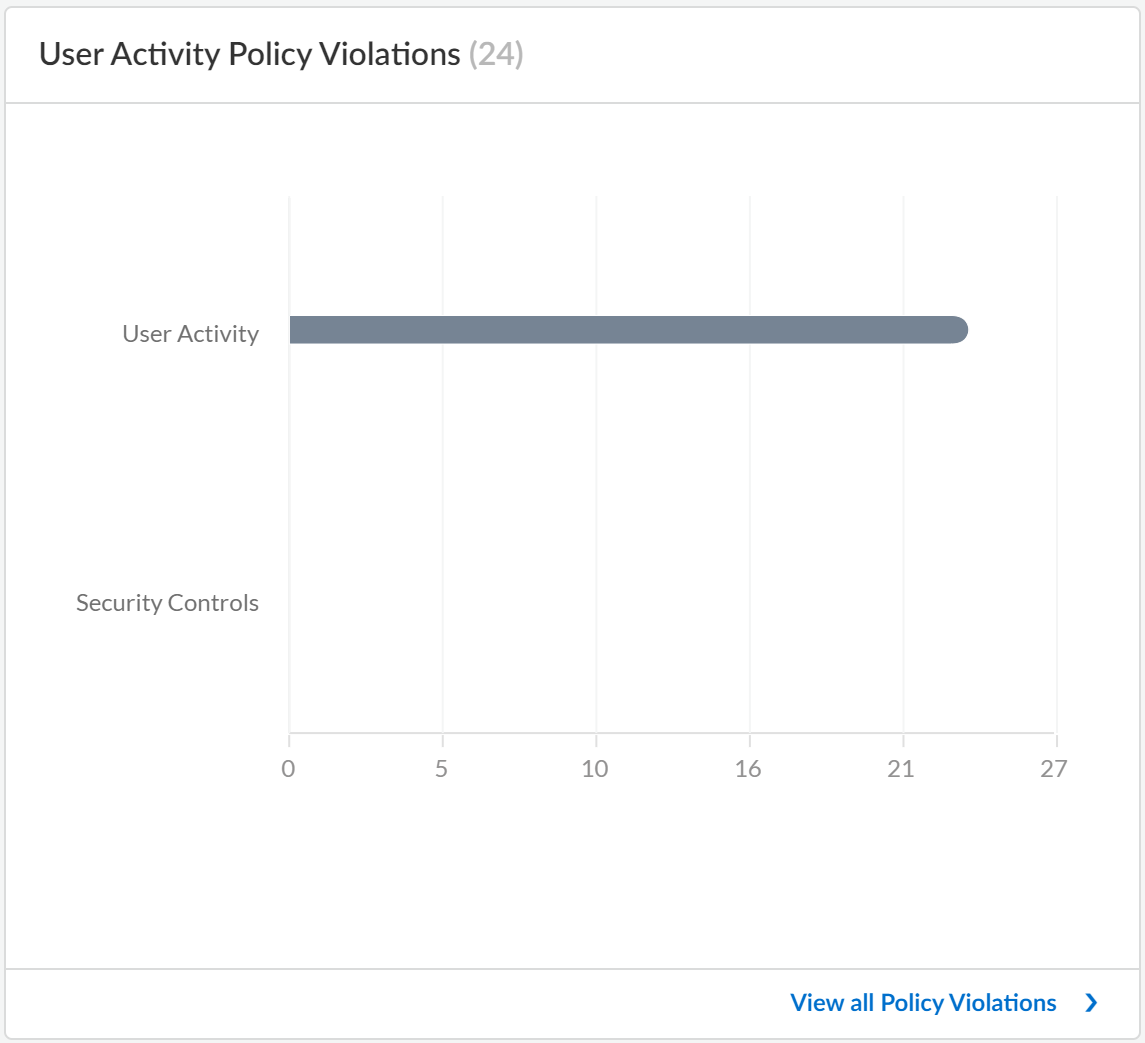
- User Activity Policy ViolationsThis widget displays the policy violations for User Activity and Security Controls policies.
![]()
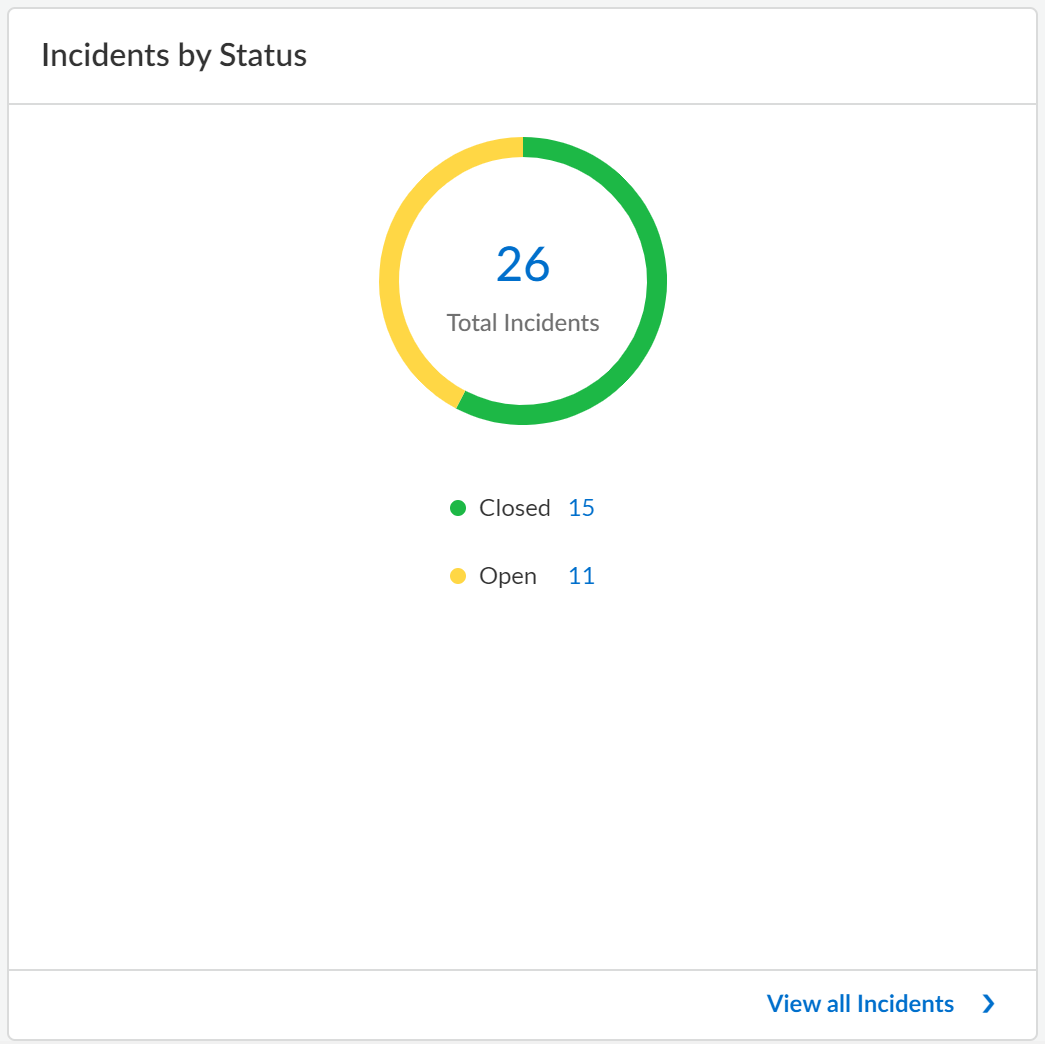
- Incidents by StatusThis widget displays the status of incidents. The two states are Open and Closed.
![]()
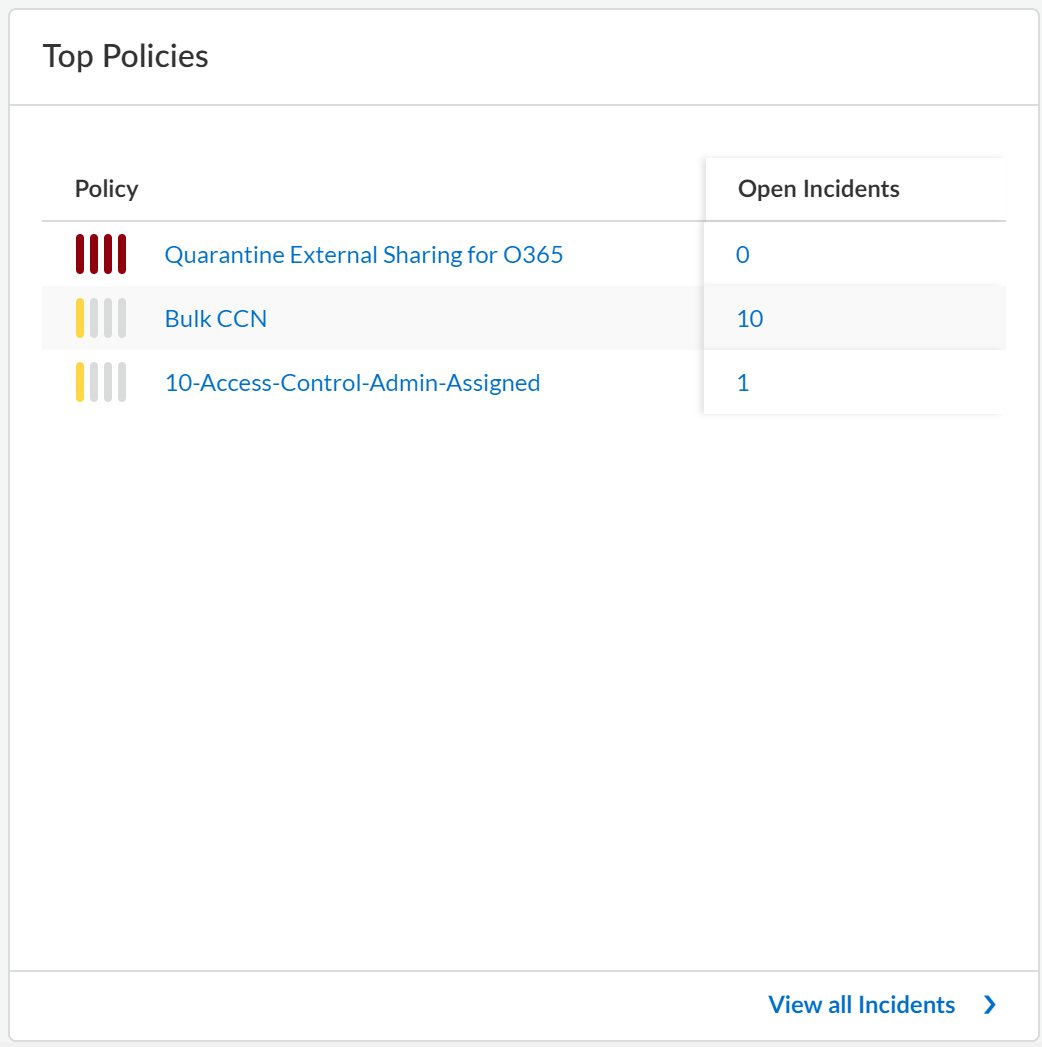
- Top Policies
The Top Policies widget summarizes the number of open incidents detected against each policy. When Data Security starts scanning files and matching them against enabled policy rules, the default action is to generate a log entry when a policy violation occurs. If you enable email alerts for high-risk issues such as malware or PII compliance violations, you would also receive an automatic email notification in addition to incident logging.The incidents widget displays a summary of policies with the number of open violations, any new incidents discovered in the last seven days, and the number of resolved incidents. The Data Security service sorts the violations in the incidents widget from the highest severity level to the lowest severity level so that you can assess policies with the highest severity level first.The verticals bars next to the policy names displays the severity level for each policy. Click on the policy name to get more details associated with the policy.
![]()
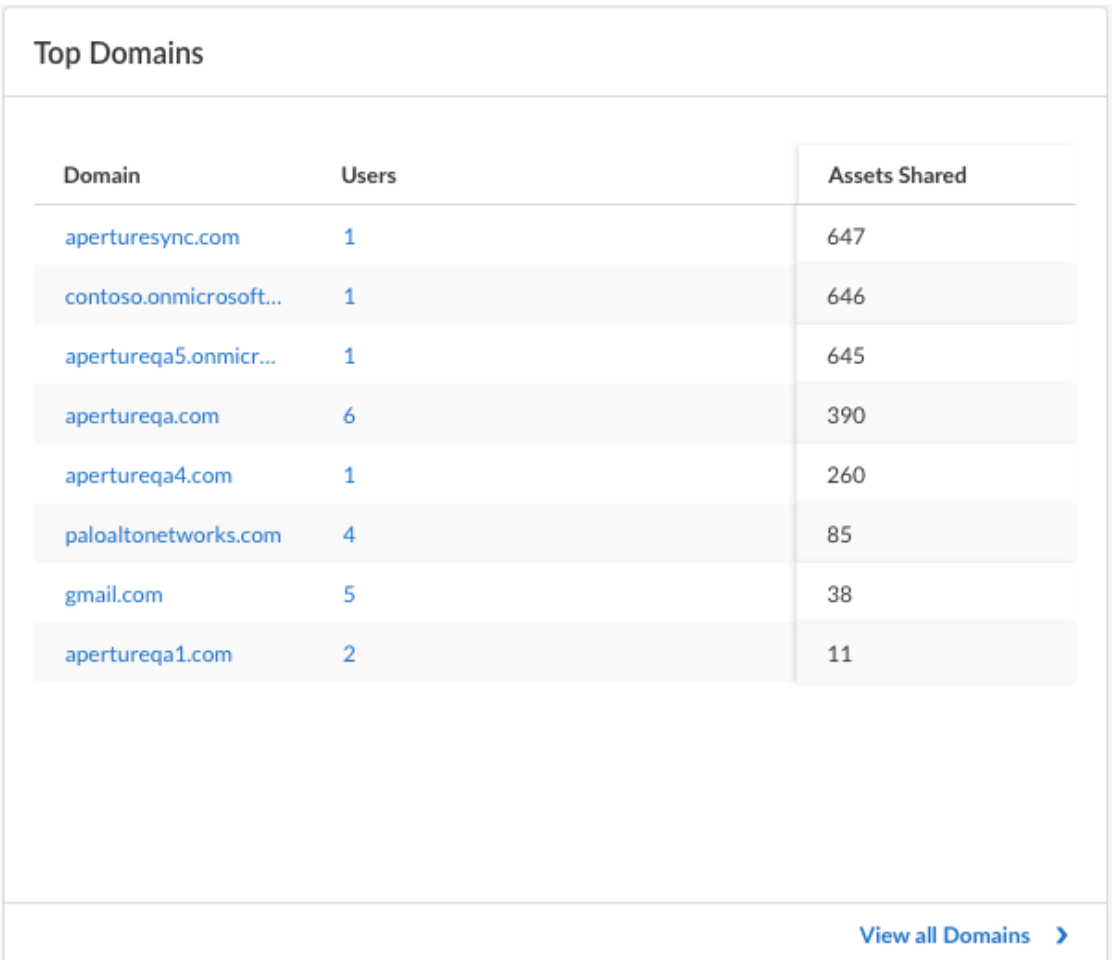
- Top DomainsThis widget will display information related to domains, users and assets shared only if you have onboarded the Google Drive app. Otherwise, this widget will be empty.The Top Domains widget lists the top 10 domains with the most assets shared with external collaborators by your internal users. Click on either Domain or Users to view more details associated with the domain.If an external user has an email address that does not belong to an internal domain, you can use Data Security to define users and domains as trusted or untrusted. Defining a domain as trusted or not trusted enables you to protect your assets and have better granular control over who has access to your assets.
![]()