- Home
- Prisma Access
- Prisma Access Administration
- Configure Dynamic Privilege Access Settings
- Configure Project-Specific Prisma Access Agent Settings
- Configure Forwarding Profiles to Manage Agent Traffic for Dynamic Privilege Access Agents
- Verify and Troubleshoot Forwarding Profile Configurations for Dynamic Privilege Access Agents
Prisma Access
Verify and Troubleshoot Forwarding Profile Configurations for Dynamic Privilege Access Agents
Table of Contents
Expand All
|
Collapse All
Prisma Access Docs
-
- 6.1 Preferred and Innovation
- 6.0 Preferred and Innovation
- 5.2 Preferred and Innovation
- 5.1 Preferred and Innovation
- 5.0 Preferred and Innovation
- 4.2 Preferred
- 4.1 Preferred
- 4.0 Preferred
- 3.2 Preferred and Innovation
-
-
- 4.0 & Later
- Prisma Access China
-
-
Verify and Troubleshoot Forwarding Profile Configurations for Dynamic Privilege Access Agents
You can verify your forwarding profile configurations and perform
high-level troubleshooting of split tunnel issues on your endpoints.
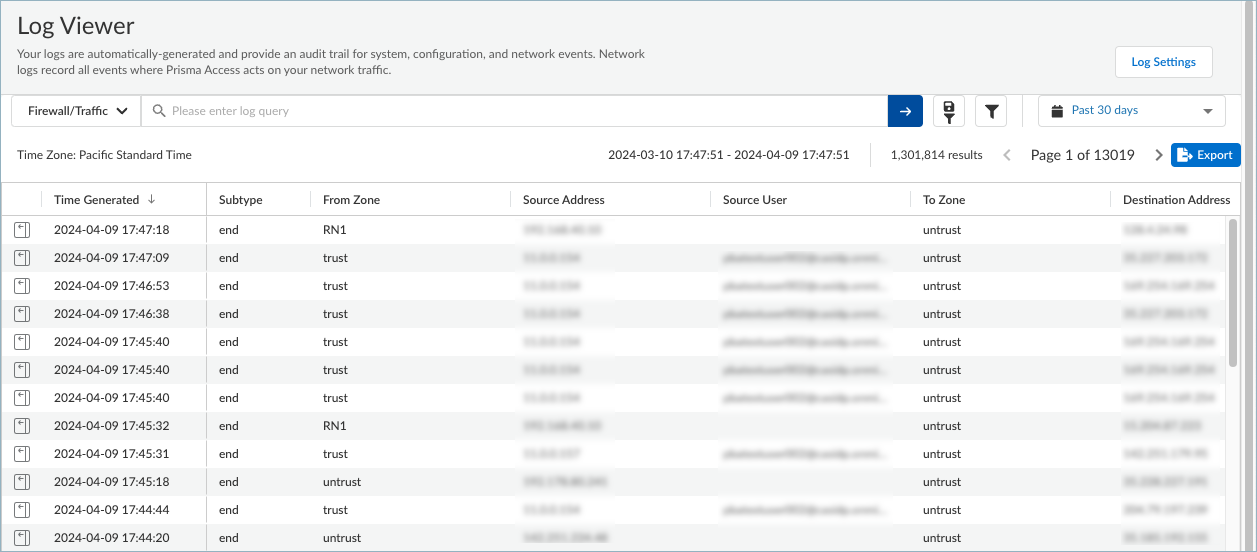
After you configure a forwarding profile, you can verify whether the traffic is being
directed as intended by viewing the traffic log files. You can view the traffic logs
in the log viewer or by using the Prisma Access command-line tool (PACli) on an
endpoint.
- To view the traffic log files from the log viewer or Strata Logging Service:
- Select Log Viewer.View the Firewall/Traffic logs for more details.
![]() To view the traffic log files on an endpoint:
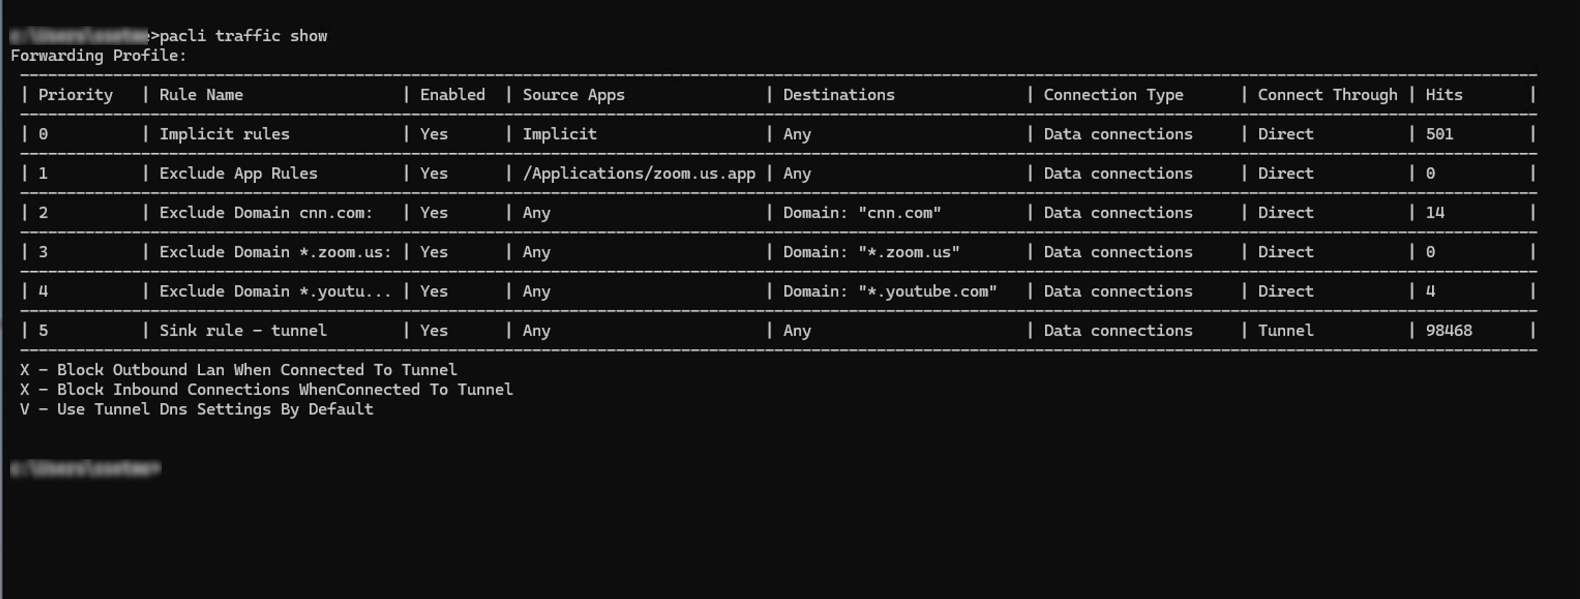
To view the traffic log files on an endpoint:- Start the Start the remote shell in ConfigurationEndpoint Management or open a Windows command prompt or macOS terminal window on an end user's device.To show the forwarding rules in a forwarding profile, issue the following command:
- On Windows:
"C:\Program Files\Palo Alto Networks\Prisma Access Agent\pacli" traffic show
- On macOS:
/Applications/Prisma\ Access\ Agent.app/Contents/Helpers/pacli traffic show
If you set up an environment variable for the PACli tool (pacli), you can just enter pacli traffic show.![]() The sample PACli command-line output shows a table containing the forwarding rules that are in effect in the forwarding profile, including the priorities of the forwarding rules. The traffic enforcement selections for the forwarding profile are also shown. This table corresponds to the forwarding rules that you set up in your forwarding profile.To show the details of a forwarding rule, issue the following command:
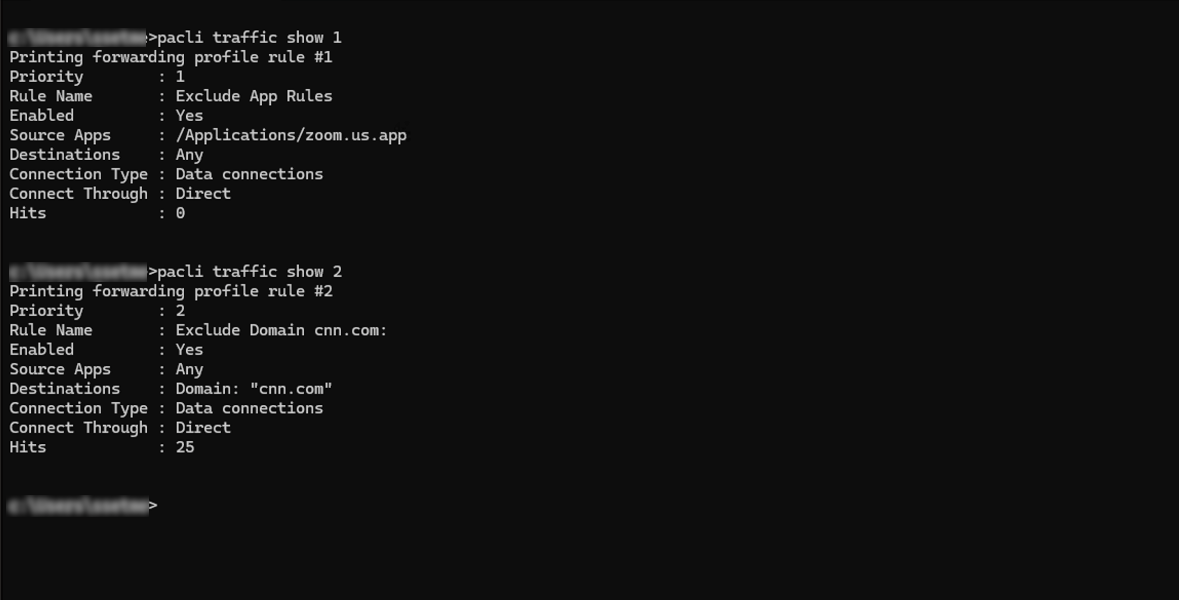
The sample PACli command-line output shows a table containing the forwarding rules that are in effect in the forwarding profile, including the priorities of the forwarding rules. The traffic enforcement selections for the forwarding profile are also shown. This table corresponds to the forwarding rules that you set up in your forwarding profile.To show the details of a forwarding rule, issue the following command:pacli traffic show <number>
Where <number> is the number in the Priority column, for example:![]() To troubleshoot split tunnel issues, you might need to examine what agent traffic is inside or outside the tunnel. You can do this by showing the Prisma Access Agent connection log. Issue the following command:
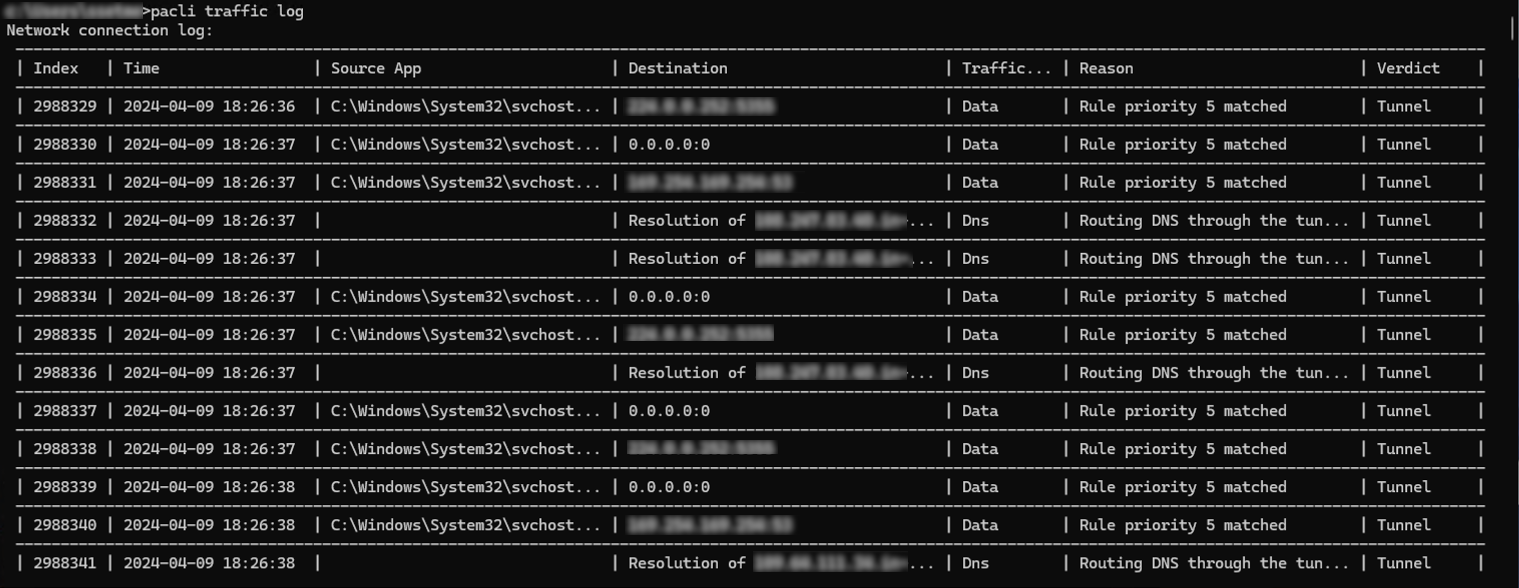
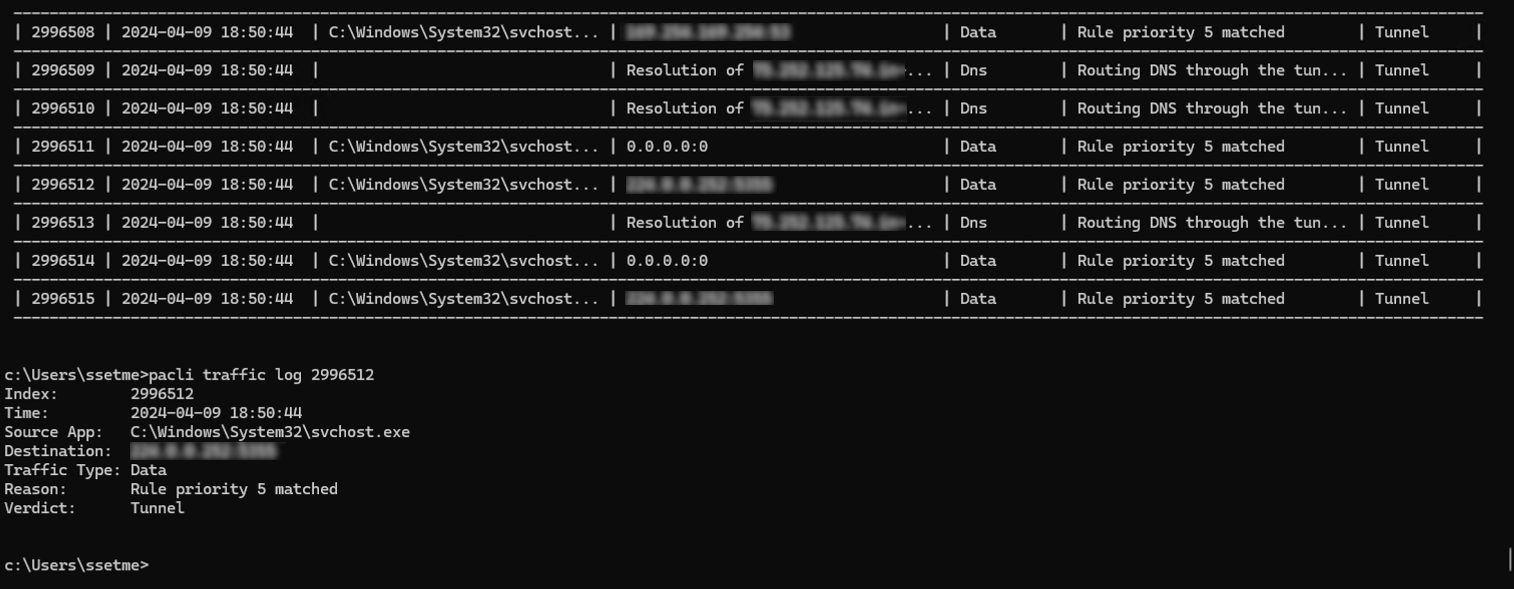
To troubleshoot split tunnel issues, you might need to examine what agent traffic is inside or outside the tunnel. You can do this by showing the Prisma Access Agent connection log. Issue the following command:pacli traffic log
![]() To show an individual log entry, issue the following command:
To show an individual log entry, issue the following command:pacli traffic log <index>
Where <index> corresponds to the index number for the entry. For example:![]() You can also export the connection log to a file for further analysis by issuing:
You can also export the connection log to a file for further analysis by issuing:pacli traffic log export <filename>

