Prisma Access
Notification Profiles
Table of Contents
Expand All
|
Collapse All
Prisma Access Docs
-
- 6.1 Preferred and Innovation
- 6.0 Preferred and Innovation
- 5.2 Preferred and Innovation
- 5.1 Preferred and Innovation
- 5.0 Preferred and Innovation
- 4.2 Preferred
- 4.1 Preferred
- 4.0 Preferred
- 3.2 Preferred and Innovation
-
-
- 4.0 & Later
- Prisma Access China
-
-
Notification Profiles
View information about your notification subscriptions and create a new or modify an
existing notification profile.
| Where can I use this? | What do I need? |
|---|---|
|
|
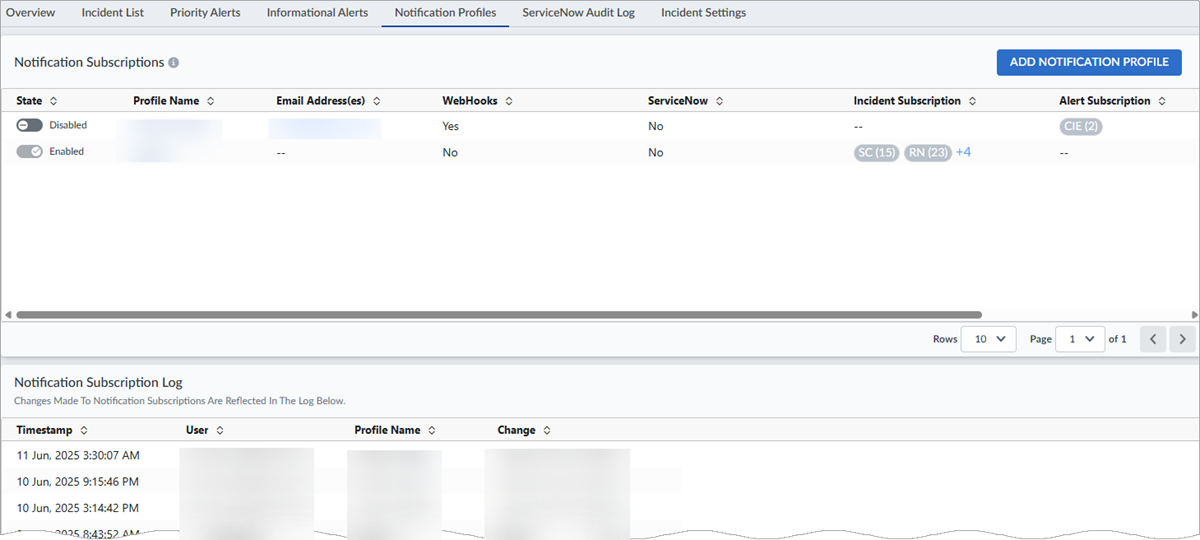
In Strata Cloud Manager, select IncidentsPrisma AccessNotification Profiles to view information about Notification
Subscriptions and create a new or modify an existing notification
profile.
The default notification profile remains the
default. You can't designate another notification profile to be the default
profile.
Notification Profiles shows all notification profiles
available for a specific tenant in the Notification Subscriptions
table and all profile subscription logs for the tenants in your environment.

When you create or modify a notification profile, you can enable Prisma Access to send email or webhook alerts when it initially detects an issue and
when the issue is resolved. These alert notifications describe the issue and impact, and
include a link to Prisma Access where you can investigate further.
The Palo Alto Networks email address from which you receive alert notifications is
noreply@paloaltonetworks.com.
Manage Notification Subscriptions
Notification Subscriptions offers a view of all available
profiles, enables you to create new profiles and modify existing ones, and enables
Prisma Access to send alerts.

- Enable or disable a profile from the State column.
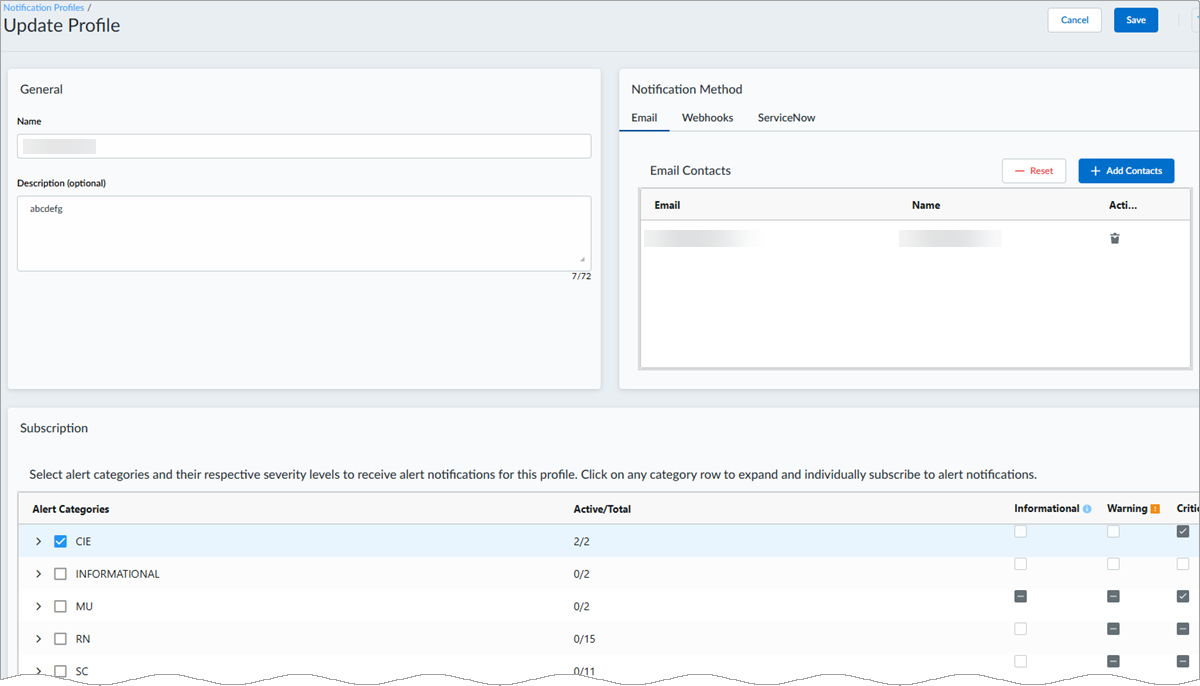
- Select a Profile Name to open the Update Profile page and modify the profile.
Notification Subscription Log
You can view changes to all profiles, such as when you add, modify, or delete
profiles in the Notification Subscription Log.
Add Notification Profiles
You can create an unlimited number of notification profiles, with selections for
subtenants, notification methods, and alert subscriptions.
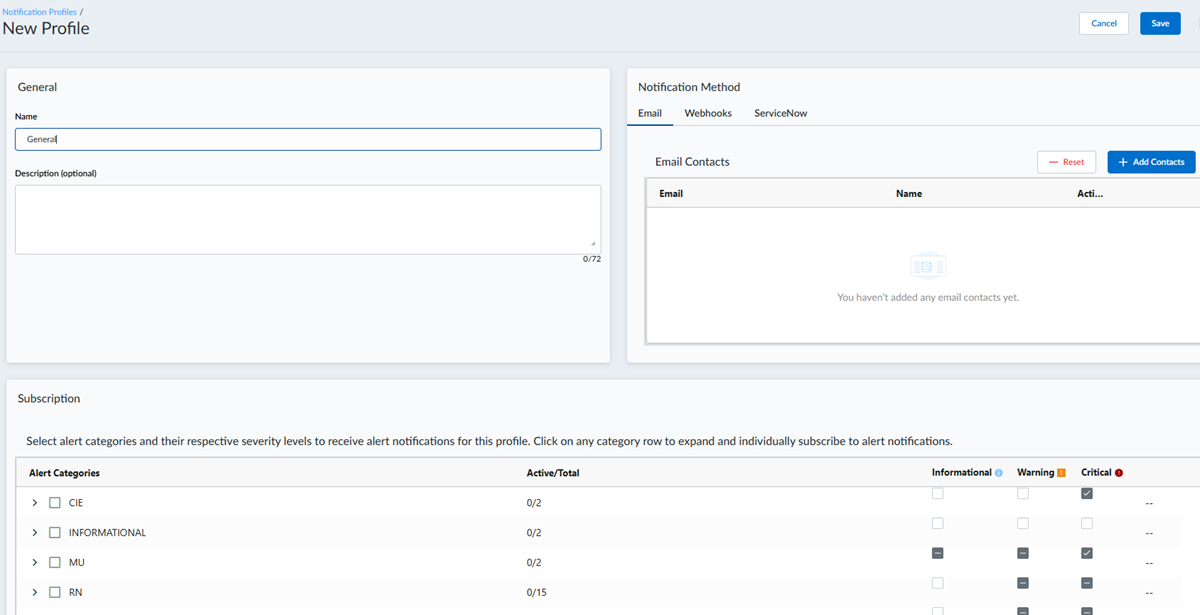
- From the IncidentsPrisma AccessNotification Profiles page, select Add Notification Profile. The
New Profile window appears.
![]()
- Under General:
- Name—Enter a profile name.
- Sub-Tenant ID—For Email or Webhook Notifications, select one or more subtenants.
- Description (optional): Enter an optional description of up to 72 characters.
- Under Notification Method, select
Email, Webhooks, or
ServiceNow:
- To use Email:
- Under Email Contacts, select Add Contacts.
- Enter a valid Email and an optional Name, and press Enter.
- You can add multiple email contacts using the Add Contacts button.
- Webhooks are custom HTTP callbacks that you define. They are triggered
by an event, such as pushing code to a repository or posting a comment
on an issue. When the event occurs, the source app makes an HTTP request
to the URI configured for the webhook. You can create one webhook notification per profile.To use Webhooks:
- Enter a webhook name and a valid URL. Use only standard web ports. Custom web ports are not allowed.
- Under Auth Type, select
None, Basic,
or Token.
- None—You don’t need to add any more information.
- Basic—Enter the username and password of the webhook.
- Token—Enter the webhook token.
- Enter a webhook name and a valid URL.
- To use ServiceNow:
- Enter a Name for the profile.
- Enter an optional Description.
- Under Configure Incident Management
Details, enter:
- A profile Name.
- A valid Table URL that links to
your ServiceNow table. The URL to connect the ServiceNow
instance through the ServiceNow Table APIs must include
the entire domain name and table name in the following
format:https://<domain name>/api/now/table/myTablewhere myTable is the name of the Table on ServiceNow where the tickets will be created.
- The Auth Type.
- A Username.
- A unique Password.
- Enter your ServiceNow fields in this table to make sure ServiceNow pushes the correct data for a SASE incident. Enter data in the mandatory fields marked with asterisks (*).
- The Custom Field enables you to customize a static field to use in any way you want. For example, you can set up the Custom Field to show PANW as a static entry in all your rows. This can be especially useful if you're using a master table for integrations with several vendors. It helps you identify the source of the incidents and tickets more easily.
- Under SASE Mapping, move the
Do you want to visualize ServiceNow incident
updates on the Prisma Sase dashboard? toggle to
Yes for a bidirectional integration
with ServiceNow. As part of a bidirectional integration, Strata Cloud Manager not only automatically generates incidents on
ServiceNow but also gets incident updates from ServiceNow back
to the Strata Cloud Manager dashboard.Enter ServiceNow Mapped Field data in the mandatory fields (with asterisks), and select Run Test Case to create a dummy incident. The test case helps verify whether your ServiceNow integration is working.
- The Please Authorize ServiceNow Integration pop-up appears whether you're using a bidirectional or unidirectional integration. Select Authorize to confirm that you want to have your Strata Cloud Manager incidents appear on your ServiceNow instance and ServiceNow incident updates appear on your Strata Cloud Manager interface.
- After you have successfully saved your ServiceNow profile, it appears in the Notification Subscriptions table, with Yes in the ServiceNow column. The ServiceNow column says Yes (Test Successful) if you ran a successful test case, and Yes (Test Not Executed) if you did not run a test case at all.
- To use Email:
- Under Subscription, you can select all alerts present
under an alert category, or you can select > to the left
of the alert category name to expand the category and specify the alerts for
which you want to be notified. The default profile receives Informational alerts for the tenant. In other notification profiles, you can elect to receive informational alerts or not.
- Save your changes.
- For ServiceNow: After you successfully save your ServiceNow profile, it appears in the Notification Subscriptions table, with Yes in the ServiceNow column. The ServiceNow column says Yes (Test Successful) if you ran a successful test case, or Yes (Test Not Executed) if you did not run a test case at all.
- You can have only one active ServiceNow integration at a time. The State column in the Notification Subscriptions table shows your active ServiceNow integration is Enabled.
Edit an Existing Profile
To edit an existing profile, select either the Profile Name or
the pencil in the Actions column. The Update
Profile page appears. Make your changes, and
Save to update the profile.

Webhook Data Schema for Incidents
The following table shows the data model for Prisma Access incidents. Not all
fields listed are applicable to all incident types.
| Rule | Description |
|---|---|
|
#kind
|
Incident.
|
|
#incident_id
|
Unique incident ID.
|
|
title
|
Incident description to be used for display purposes only.
|
|
#severity
|
Incident severity, such as High, Medium, or Low.
|
|
#status
|
Incident status. Valid values are Raised, Cleared, RaisedChild,
and ClearPending
|
|
#clear_reason
|
Reason the incident is cleared. Valid values are Auto, Manual,
and No Data Timeout
|
|
#code
|
Unique alert code. It is in a flat namespace; for example,
INC_CIE_AGENT_DISCONNECT.
|
|
#category
|
Alert category, such as RN (remote networks) or SC (service
connection).
|
|
#sub_category
|
Alert subcategory.
|
|
#tenant_id
|
Tenant ID.
|
|
#sub_tenant_id
|
Subtenant ID.
|
|
#sub_tenant_name
|
Subtenant name.
|
|
#resource_keys
|
These keys identify an unique resource. These fields vary
depending on the incident code.
|
|
#resource_data
|
Resource data fields vary depending on the alert code state,
whether Up or Down.
|
|
#version
|
Incident model version.
|
|
#raised_time
|
Time the incident was raised.
|
|
#updated_time
|
Time the incident was updated.
|
|
#cleared_time
|
Time the incident was cleared.
|
Incident Webhook Example
{
  "kind": "incident",
  "data": {
    "incident_id": "", #UUID to uniquely identify an incident. Unique across all the incidents generated by Cosmos
	"event_type":"", INC_CREATED, INC_CLEARED, INC_AL_ASSOCIATE, INC_HAS_PARENT
    "title": "", #Incident description. Should be used for only display purposes
    "severity":  "", #Valid values High/Medium/Low
    "status": "", #Valid values are Raised/Cleared/RaisedChild/ClearPending
    "clear_reason": "", #Valid values are Auto/Manual/No Data Timeout
    "code": "", #Unique alert code across Cosmos alerts. It is in a flat namespace (ex: AL_SC_PRIMARY_TUNNEL_DOWN, etc)
    "category": "", #Alert category (Example: RN, SC, etc)
    "sub_category": "", #Alert sub category
    "tenant_id": "",
    "sub_tenant_id": "",
    "sub_tenant_name": "",
    "resource_keys": { # json string These keys identify an unique resource. These fields vary depending on the alert code
      "tenant_id": "",
      "sub_tenant_id": "",
      "tunnel_name": "SanJoseTunnel",
      "node_type": "51",
      "site_name": "SanJose",
	  "bgp_peer_name": "",
    },
    "resource_data": { # json string These fields vary depending on the incident code
        "state": "Down"
    },
	"correlated_alerts" : {
	[{"alert_id":"", "state":"", "updated_time":"", "message":""}],
	},
	"parent_incidents" : {
	[{"incident_id":""}],
	},
 	"child_incidents" : {
	[{"incident_id":""}],
	},
    "version": "1.0", #Alert model version. It will be 1.0
    "raised_time": "2021-07-02 23:12:13 UTC",
    "updated_time": "2021-07-03 23:12:13 UTC",
    "cleared_time": "2021-07-03 23:12:13 UTC"
  }
}
Webhook Data Schema for Alerts
The following table shows the data model for Prisma Access alerts. You can use
descriptions of these alert fields to configure the webhook endpoint, ingesting
these alerts in order to interpret the event in your network deployment correctly,
and/or automate workflows in response to the network event that is observed. Not all
fields listed are applicable to all alert types.
| Rule | Description |
|---|---|
|
#kind
|
Alert type, such as Priority.
|
|
#alert_id
|
Unique alert ID.
|
|
#message
|
Alert description, used only for display purposes.
|
|
#severity
|
Alert severity, such as High, Medium, Low, or Informational.
|
|
#state
|
Alert state. Valid values are Raised and Cleared.
|
|
#clear_reason
|
Reason for the alert. Valid values are Auto, Manual, and No Data
Timeout.
|
|
#code
|
Unique alert code. It is in a flat namespace; for example,
AL_SC_PRIMARY_TUNNEL_DOWN.
|
|
#alert_code_message
|
Specifics about the alert code.
|
|
#category
|
Alert category, such as RN (remote networks) or SC (service
connection).
|
|
#sub_category
|
Alert subcategory.
|
|
#tenant_id
|
Tenant ID.
|
|
#sub_tenant_id
|
Subtenant ID.
|
|
#sub_tenant_name
|
Subtenant name.
|
|
#resource_keys
|
These keys identify an unique resource. These fields vary
depending on the alert code.
|
|
#resource_context
|
Resource context detailed in the following several fields.
|
|
#resource_data
|
Resource data fields vary depending on the alert code state,
whether Up or Down.
|
|
#version
|
Alert model version, which is 1.0.
|
|
#raised_time
|
Time the alert was raised.
|
|
#updated_time
|
Time the alert was updated.
|
|
#cleared_time
|
Time the alert was cleared.
|
Alert Webhook Example
{
  "kind": "alert",
  "data": {
    "tenant_id": "1234567890",
    "sub_tenant_id": "1234567890",
    "sub_tenant_name": "",
    "alert_id": "f0e30344-62ac-4a5c-bd11-b45ffb09ac8a",
    "severity": "High",
    "state": "Raised",
    "message": "PRIMARY WAN tunnel Test1 for the Remote Network is down",
    "alert_code_message": "PRIMARY WAN tunnel Test1 for the Remote Network is down",
    "code": "AL_RN_PRIMARY_WAN_TUNNEL_DOWN",
    "category": "RN",
    "sub_category": null,
    "clear_reason": "",
    "raised_time": "2022-08-18 05:36:02 UTC",
    "cleared_time": null,
    "updated_time": "2022-08-18 05:36:02 UTC",
    "resource_data": {},
    "resource_context": {
      "instance_name": "FW_12345_us-east-1_store1-1234567890",
      "instance_id": 12345,
      "instance_type": 48,
      "cluster_id": 12345,
      "location": "US East",
      "zone": "us-east4-a",
      "region": "us-east4",
      "cloud_provider": "gcp",
      "tunnel_name": "Test1",
      "source_ip_address": "1.2.3.4",
      "destination_instance_type": 0,
      "destination_ip_address": "4.3.2.1",
      "site_id": 10,
      "site_name": "10",
      "destination_zone": "N/A",
      "destination_region": "N/A",
      "sub_node_type": 0
    },
    "resource_keys": {
      "tenant_id": "1234567890",
      "sub_tenant_id": "1234567890",
      "site_id": 10,
      "tunnel_name": "Test1"
    },
    "version": "1.0"
  }
}

